Left ventricular myocardial hypertrophy (LVH), as an element of its structural restructuring, is considered a sign of morphological deviation from the norm, a clear predictor of an unfavorable prognosis of the disease that caused it , as well as a criterion determining the choice of active treatment tactics [28]. Over the past twenty years, clinical studies have been conducted that have proven the independent contribution of drug-induced reduction in LV myocardial mass (LVMM) in patients with arterial hypertension (AH), which makes it necessary to determine and control LVMM [18]. Based on these ideas, recent recommendations for the diagnosis and treatment of hypertension include the measurement of LVMM in the algorithm of antihypertensive management of patients in order to determine the presence of LVH [4, 35].
But still, there is no unambiguous idea about the pathogenicity of LVH, which is associated with interrelated problems of both methodological and methodological nature: The first concerns the reliability of methods for determining LVH, the second concerns the assessment of the results obtained in terms of the presence or absence of LVH. In addition, there are many instrumental approaches to determining LVMM.
When measuring LVMM, researchers are faced with multifactorial factors that do not influence it. This is the dependence of LVMM on body size, and the possibility of only an adaptive increase in LVMM, for example, during physical activity. There is also a difference in the sensitivity of instrumental methods for determining LVMM: some authors are inclined towards greater sensitivity of MRI measurements [1, 3].
All echocardiographic calculations of LVMM, based on determining the difference in LV volumes between the epicardium and endocardium, multiplied by myocardial density, face the problems of determining tissue interfaces and assessing the shape of the left ventricle. Moreover, many methods are based on linear measurements in M-mode under B-mode control, or directly in a two-dimensional image [24]. The previously existing problem of identifying tissue interfaces, such as “pericardium-epicardium” and “blood-endocardium”, has generally been resolved in recent years, but requires a critical attitude to the studies of past years and does not relieve researchers from the need to use all the technical capabilities of ultrasound -scanners.
Individual differences in LV geometry prevent the creation of a universal mathematical model, even in the absence of local disturbances in the structure of the LV and the approximation of its shape to an ellipse, which has generated a large number of formulas, and, consequently, criteria for determining LVH, resulting in different conclusions about the presence of hypertrophy in one and the same person. the same patient.
In addition, several calculation formulas for determining LVMM are currently used. The formulas recommended by the American Society of Echocardiography (ASE) and the Penn Convention (PC) are more often used, using three measured parameters: the thickness of the myocardium of the interventricular septum (IVS), the posterior wall of the LV (PLV) at the end of diastole and its end-diastolic size (EDD) with including (ASE formula) or not including endocardial thickness (PC formula) in left ventricular diameter, depending on the formula used. But the results obtained when applying these formulas are not always comparable, therefore, to interpret the data obtained, it is necessary to clarify the method used for calculating the parameters of the left ventricle, which in practice is not always available or is neglected. The reason for the discrepancy lies in the following. The cubic formula, originally recommended by ASE, was proposed by BL Troy and co-workers in 1972 (LVMM, gr = [(ESR+LVS+LVS) 3 -ESR 3 ]×1.05) [37] and then modified using the equation regression of RB Devereux and Reichek in 1977 (Penn Convention formula) by analyzing the relationship between echocardiographic LVMM and post-mortem anatomical LV mass in 34 adults (r=0.96, p 3 -EDR 3 ]-13.6) [16] .
The discrepancies in the values of calculated LVMM obtained using these two formulas (cubic, proposed by BL Troy, and the PC formula) were within 20% and in 1986 RB Devereux, DR Alonso at.all. Based on the autopsy of 52 patients, an adjusted equation was proposed (LVMM, gr = 0.8 × <1.04 × [(EDR + LVSD + LVAD) 3 - ELV 3 ]> + 0.6 - ASE formula). LVMM determined by the PC formula closely correlated with LVMM at autopsy (r = 0.92; p 215 g) was 100% with a specificity of 86% (in 29 of 34 patients). The cubic formula similarly correlated with LVMM at autopsy (r = 0.90; p 3 )/2.4 + EDR + TZSL + TMZH) - ((7 × EDR 3 )/(2.4 + EDR))) [36] . According to L. Teicholz, the norm is LVMM 200 g - pronounced LVH. However, these parameters can only be guidelines when using the Teicholz formula and, in addition, they do not take into account the relationship of LVMM with body size.
Virtual calculation of LVMM using the three above-mentioned formulas with a stable value of one of the parameters (either the sum of the thickness of the IVS and the LVSD, or EDR) and an increase in the other (either the EDR, or the sum of the thickness of the IVS and LVSD, respectively) by a stable arbitrary value, showed different sensitivity of the formulas to changing linear indicator [23]. It turned out that the ASE formula is more sensitive to an increase in the thickness of the myocardial walls, the Teicholz formula is more sensitive to an increase in the LV cavity, and the PC formula parity takes into account changes in the linear dimensions and thickness of the myocardium and cavity. Thus, it is better to assess LVMM due to changes in myocardial thickness using formulas that are more sensitive in this regard - ASE and PC.
The second problem, in addition to determining LVMM, is the lack of unified criteria for its indexing, and, consequently, the formation of criteria for LVH. Determining the size of organs through their allometric dependence on body weight, accepted in comparative morphology, is unacceptable in the human population due to the variability of an individual’s body weight, which depends on many factors, in particular on constitutional characteristics, physical development, as well as possible changes in organ size as a result of disease [5].
The presence of a direct dependence of LVMM on body size requires its indexation. In this regard, left ventricular myocardial mass index (LVMI) is more often calculated when standardized to body surface area (BSA). There are several more ways to calculate myocardial mass index: by height, height 2.0, height 2.13, height 2.7, height 3.0; correction using a regression model of LVMM depending on age, body mass index and BSA [7].
Studies from past years prove the influence of various factors on myocardial mass in different age groups. Thus, in early childhood, the weight of the LV myocardium is mainly determined by the number of cardiomyocytes (CMC), which reach a maximum number during the first year of life [31]. Subsequently, the growth of the LV depends on the increase in the size of the CMC (physiological hypertrophy) and on this physiological process Many factors influence - body size, blood pressure, blood volume, genetic factors, salt intake, blood viscosity [8, 10, 33, 38], which determine the phenotypic growth of LV mass. After puberty, other factors determine the degree of physiological hypertrophy, while in adults there is a correlation between LVMM and age [12]. The effect of height on the variability of LVMM was studied by de G. Simone et al. and in 1995 on 611 normotensive individuals with normal body weight aged from 4 months to 70 years (of which 383 were children and 228 were adult patients). LVMM was normalized to body weight, height, and BSA. Height-indexed 2.7 LVMM increased with height and age in children but not in adults, suggesting that other variables influence LV mass in adulthood [11].
Reasons for deviation of heart mass and mass index from normal figures
Myocardial mass is increased due to pathological processes leading to its overload:
An increase in the mass of muscle tissue also occurs normally - with intense physical training, when intensive sports activities cause the growth of not only skeletal muscles, but also the myocardium, which supplies the organs and tissues of the trainee with oxygen-rich blood.
Athletes, however, risk over time becoming people with myocardial hypertrophy, which under certain conditions can become pathological. When the thickness of the heart muscle becomes greater than the coronary arteries can supply with blood, there is a risk of heart failure. It is this phenomenon that is most often associated with sudden death in well-trained and apparently healthy people.
Thus, an increase in myocardial mass, as a rule, indicates a high load on the heart, whether during sports training or pathological conditions, but regardless of the cause, hypertrophy of the heart muscle deserves close attention.
Characteristics of the myocardium and methods for their calculation
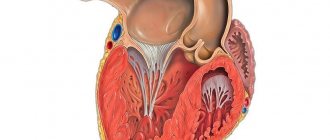
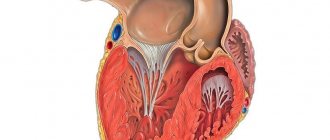
The myocardium is the muscular layer of the heart, which consists of mononuclear cells that have a special transverse arrangement. This ensures extreme muscle strength and the ability to distribute work evenly throughout the heart. The relative position of cells according to the type of intercalated discs determines the unusual properties of the myocardium. These include excitability, contractility, conduction, relaxation and automaticity.
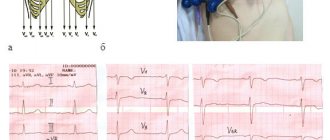
It is possible to assess whether the heart is healthy using additional instrumental examinations. Normal indicators based on the results of echocardiography of the ventricular myocardium (one of the key methods for diagnosing the pathology of blood ejection) are as follows:
- left ventricle (LV): myocardial mass - 135-182 g, 95-141 g; mass index (LVMI) - 71-94 g/m2, 71-84 g/m2 in men and women, respectively;
- right ventricle (RV): wall thickness - 3 mm; size index - 0.75-1.25 cm/m2; the diastole value at rest is 0.8-2.0 cm.
The left ventricle takes on a greater functional load than any other part of the heart and, accordingly, is more often susceptible to pathological changes. Therefore, we will consider its parameters in more detail.
The calculation of the mass of the left ventricular myocardium is obtained by performing various calculations. The calculator processes numbers using special formulas. At the present stage, two forms of calculation are recognized as the most sensitive, which are recommended by the American Society of Echocardiography (ASE) and the Penn Convention (PC) . The only difference between them is the inclusion of the thickness of the inner layer of the heart when using the first formula.
The Framingham Study was the first to show that left ventricular hypertrophy (LVH), regardless of blood pressure, is a risk factor for sudden death, congestive heart failure, ventricular arrhythmias, coronary artery disease, myocardial infarction, and cardiovascular mortality. Using echocardiography, it was found that an increase in myocardial mass by 50 g/m2 increases the relative risk of cardiovascular diseases by 1.73 times in men and 2.12 times in women [9]. The relative risk of death increases by 2.1 times with an increase in myocardial mass by 100 g. Mortality from cardiovascular diseases in patients with hypertension in the presence of LVH is 25 times higher (15%) than in its absence (0.6%) [8].
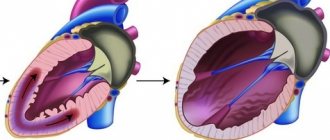
It is believed that LVH is an adaptive response to increased hemodynamic load or a consequence of a genetic defect. However, recently it has become obvious that anatomical changes in the LV are not always accompanied by an increase in myocardial mass. There is a change in the architectonics of the myocardial interstitium, which leads to fibrosis and specific morphological changes or remodeling of the myocardium [2,4,5].
EchoCG in patients in response to an increase in the load on the heart reveals various changes in the shape of the LV. The classification is based on the determination of the LV myocardial mass index (LVMI) and the relative thickness of the LV walls (RLT) [3,6]. In the “pure” form of cardiac pressure overload, LVH often has a concentric variant of remodeling—an increase in LVMM and TPV >0.45 (LVCH). When there is volume overload, as is observed in obesity, it takes on an eccentric form - an increase in LVMM and TVR < 0.45 (LV EGL). A worse prognosis (mortality 21%, rate of other cardiovascular complications 31%) was observed in individuals with concentric LVH [9]. In the absence of LVH, but with TVR ³ 0.45, concentric remodeling (CR) is determined.
Currently, the pathogenetic aspects of the development of LVH in metabolic syndrome have not been fully established. It is believed that several factors play a role in its occurrence. Of primary importance are the systolic tension of the LV walls, an increase in circulating blood volume and its viscosity, and total peripheral resistance. An increase in the systolic tension of the LV walls, which causes an increase in the number of sarcomeres in the myocardium, is primarily caused by pressure overload, characteristic of hypertension [2]. In addition, in hypertension, an increase in the thickness of the intima of peripheral arteries was revealed, which increases the total peripheral vascular resistance and afterload on the heart. In obesity, increased stroke volume leads to increased cardiac output and eccentric LVH develops [1,7]. In the case of a combination of hypertension and obesity, a mutual aggravation of hemodynamic processes occurs, a mixed load on the heart is created - pre- and afterload increases. However, in both nosologies, pronounced neurohumoral activation of the sympathetic and renin-angiotensin systems is observed, with the production of hypertrophic stimuli. The effect of hyperinsulinemia/insulin resistance on LVH can be realized both through the direct hypertrophic effects of insulin on muscle tissue, and indirectly [3,7,10].
Detection of LVH is of great clinical importance, since its presence has a significant impact on the course and prognosis of the disease. It is obvious that LVMM largely depends on body weight, gender, and age. Therefore, it is customary to index LVMM to body area or height. In recent years, there has been a tendency to use lower values of LVMM as a criterion for its hypertrophy [6].
Impact on intermediate points in the treatment of arterial hypertension, in particular on LVH, has become one of the leading directions in cardiology in recent decades. Available evidence suggests that regression of LVH leads to a twofold reduction in the risk of death [5,8].
The purpose of our work: to study the features of myocardial remodeling in patients with metabolic syndrome and evaluate the effect of multifactorial therapy on regression
Materials and methods
84 people aged 43-61 years were examined. All patients had abdominal obesity - BMI > 26 kg/m2, and waist-to-hip ratio (WC/HC) in women > 0.85, in men > 0.9. 59 patients had diabetes mellitus (DM) type 2, the average duration of the disease was 6.4±2.2 years. The patients' causal pressure was measured and 24-hour monitoring (ABPM) was performed using portable devices AVRM-04 (Hungary). Patients were divided into 5 groups based on ABPM results. Arterial hypertension groups 1 and 4 included patients with high “office” blood pressure, which was confirmed by ABPM data. Group 2, which we designated as the group of unstable arterial hypertension, was formed from patients indicating episodes of high blood pressure with “office” blood pressure more than 140/90 mm Hg, but according to ABPM results, having an average daily SBP < 140 mm Hg. Art. and mean DBP < 90 mmHg. Art. Groups 3 and 5 with normal blood pressure included patients with blood pressure less than 130/85 mm Hg. according to ABPM data. Groups 1,2,3 were formed from patients with diabetes mellitus.
In a blood plasma sample taken on an empty stomach, uric acid, glucose, creatinine, and plasma lipids were determined. The content of insulin (IRI), C-peptide, and cortisol was determined by radioimmunoassay using standard test kits. "Immunotech" (Czech Republic). Insulin resistance was assessed using indices: HOMA insulin resistance index (HOMA IR) (fasting insulin X fasting glucose / 22.5), beta-cell function index (HOMA bc) (20 X fasting insulin / fasting glucose - 3.5).
Echocardiographic examination was performed using an HP SONOS 4500 device in M-modal and two-dimensional mode in standard echocardiographic positions. The generally accepted indicators were studied using the Teicholz method. Left ventricular myocardial mass (LVMM) was determined according to Devereux R. and Reicheck N. (1977): LVMM = 1.04 *[(LVM+LVMS+EDR)3 - ELV3 ] - 13.6. Myocardial mass index was calculated as the ratio of MM to body surface area, to height, and to height to the power of 2.7. We have taken several indices to determine LVH. Indexation by body area (MI/PT) in overweight individuals is accompanied by insufficient detection of cases of LVH; the MI/R index (height) underestimates the incidence of LVH in tall patients, while indexing by P2.7 reduces the discrepancy between height and height. depends little on weight. LVH was recorded using known parameters, and a combination of more than 2 criteria was accepted as LVH.
1. LVMM more than 200 grams;
2.1. MI/R in men > 163 g/m, in women > 121 g/m;
2.2. MI/PT in men > 134 g/m2, in women > 110 g/m2;
2.3. MI / HEIGHT 2.7 in men > 53 g/m 2.7, in women > 47 g/m 2.7
3. thickness of the IVS and/or LVSD ³ 1.1 cm.
Statistical processing was carried out using the statistical package Statistica 5.0. The average values of the indicators and standard deviation (M±SD) were calculated. When comparing samples, nonparametric criteria were used: the Mann-Whitney U test, the Wald-Wolfovich rank test, and the Kolmogorov-Smirnov test. To establish the relationship between signs, multivariate correlation analysis was used using Pearson and Spearman tests. Differences in values and correlations were considered significant at p < 0.05. [4]
results
Data on the morphometric parameters of the heart and its contractility are presented in Table 1.
Table 1.
Indicators of echocardiography of the heart by group
| Index | Group 1 (n=26) | Group 2 (n=19) | Group 3 (n= 14) | Group 4 (n=15) | Group 5 (n=10) | R |
| LP ml | 3,7± 0,59 | 3,54±0,54 | 3,44± 0,57 | 3,47± 0,64 | 3,43± 0,43 | nz |
| SR ml | 3,23±0,57 | 3,36±0,39 | 3,21±0,48 | 3,2±0,42 | 3,0±0,44 | nz |
| KDR ml | 5,08± 0,44 | 4,96±0,47 | 4,89± 0,35 | 4,84± 0,44 | 4,97± 0,37 | 2-4<0,05 |
| KSR ml | 42,31±13,5 | 45,16±12,2 | 41,75±14,0 | 43,93±13,1 | 35,17±23,2 | 1-3< 0,05 |
| KDO ml | 130,2± 32,8 | 123,0±25,6 | 112,2± 23,4 | 114,31±28,4 | 120,2±23,2 | 1-3< 0,05 |
| UO ml | 81,77± 16,0 | 115,26±16,4 | 71,2± 11,6 | 73,8± 18,1 | 85,3± 13,7 | nz |
| EF% | 66,69± 10,3 | 65,95± 9,3 | 61,3± 6,0 | 63,2± 4,4 | 71,5± 5,3 | 1-3<0,005 4-5<0,01 |
| UGH | 37,66± 8,6 | 48,44± 12,0 | 54,5± 16,5 | 52,15± 10,5 | 67,6± 11,2 | 1-2<0,01 1-3< 0,01 1-4<0,01 4-6< 0,05 |
| MZhP mm | 1,23± 0,13 | 1,31± 0,12 | 0,98± 0,15 | 1,15± 0,17 | 1,07± 0,09 | 1-2< 0,05 1-3< 0,0005 2-3< 0,01 |
| ZSLZh mm | 1,2± 0,14 | 1,11±0,09 | 1,02±0,13 | 1,08±0,17 | 1,03±0,09 | 1-2< 0,05 1-3< 0,001 1-4< 0,05 2-3<0,05 |
| LVMM g | 292,47 ±60,67 | 250,64 ±52,86 | 206,9 ±44,15 | 240,49 ±69,85 | 201,5 ±9,45 | except 4-5 |
| IM/R g/m | 179,41 ±39,0 | 150,8 ±30,4 | 130,4 ±25,0 | 148,9 ±44,7 | 118,4 ±3,4 | |
| MI/PT g/m2 | 153,54±37,4 | 128,56±26,5 | 115,96±20,4 | 127,19±37,5 | 95,1 ±4,8 | |
| IM/P2.7 g/m 2.7 | 78,7 ±20,56 | 63,9 ±13,76 | 59,7 ±10,22 | 66,26±21,82 | 48,12 ±3,4 | except 1-4 |
Echocardiographic parameters of systolic function of the left ventricular myocardium SV, EF, FU were not lower than in healthy people, and in the groups mainly depended on the degree of increase in blood pressure. In the absence of differences in stroke volume (SV), multidirectional values of contractility indices were determined. Thus, among patients with normal blood pressure, the ejection fraction (EF) and the degree of shortening of the anterior-posterior dimension of the LV (AF) were higher than in patients with hypertension. Among the DM 2 groups, the contractility index - EF was lower in the AH group, with higher values of EF and EDV compared to the normal BP group. In patients in this group, a high ejection fraction was maintained by increasing LV volume, but a decrease in EF could be evidence of latent decompensation.
The volumetric parameters of ECHO-CG by group also depended on the presence of hypertension and type 2 diabetes. There were no differences in patients with type 2 diabetes and obesity without hypertension (groups 3 and 5) and in patients of groups 2 and 3: type 2 diabetes with unstable hypertension and with normal blood pressure. Of particular interest is the comparison of groups 3 and 4, from which it follows that patients with type 2 diabetes and unstable hypertension had the same parameters of intracardiac hemodynamics as patients with hypertension and obesity and, moreover, they exceeded them in terms of EDR.
Analysis of the average thickness of the LV walls showed that in groups 1, 2 and 4, the average thickness of the LVAD and IVS exceeded 1.1 cm, which indicated their hypertrophy. Indicators of the structural characteristics of the myocardium and the thickness of the LV walls were greatest in individuals with type 2 diabetes and hypertension, even when compared with hypertension and obesity.
Analysis of myocardial mass indices showed that indexing by height 2.7 reveals a greater percentage of LVH in obese groups than others. The LVMM index to body area led to an underestimation of the number of patients with LVH by approximately 14%, this was especially true in patients with a BMI of more than 30 kg/m2.
The indicators of groups 2 and 3 are noteworthy. Patients with type 2 diabetes and unstable hypertension (who had normal average daily blood pressure values) had LVH in almost 90% of cases. Moreover, the incidence of LVH in the group of patients with type 2 diabetes and normal blood pressure (where 70% of individuals had optimal blood pressure) was the same as in patients with hypertension without diabetes.
LV remodeling was generally detected in the majority of patients (Table 2). Among patients suffering from hypertension, patients with concentric LVH predominated. In patients with type 2 diabetes without hypertension, the percentage of patients with LVCH and LVEF was approximately the same. It is worth noting that among patients with type 2 diabetes and normal blood pressure, the number with LVH was the same as in patients with hypertension without type 2 diabetes. Therefore, patients with type 2 diabetes as part of the metabolic syndrome have a high prevalence of LVH, regardless of the level of hypertension.
Table 2.
The nature of myocardial remodeling in groups
| Group 1 (n=26) | Group 2 (n=19) | Group 3 (n=14) | Group 4 (n=15) | Group 5 (n=10) | |
| LVH % | 100 | 89,5 | 50 | 46,6 | 10 |
| LVEF % | 65,4 | 52,9 | 42,8 | 85,7 | 100 |
| LVEF% | 34,6 | 47,1 | 57,2 | 14,3 | 0 |
| KR % | 0 | 10,5 | 0 | 13 | 37,5 |
| Norm % | 0 | 10,5 | 50 | 40 | 50 |
When comparing general clinical characteristics in patients with LVCH compared with LVEG, significantly pronounced microalbuminuria was observed (135.8 ± 40.8 mg/s and 29.52 ± 15.7 mg/s - p < 0.05, respectively). The groups of patients did not differ in the duration of hypertension (6.39 ± 3.9 g and 5.39 ± 5.1 g, respectively).
When analyzing the parameters of peripheral hemodynamics in groups with different types of myocardial remodeling, higher pressure load indicators were revealed in patients with LVCH. There was a high degree of correlation between the level of cortisol and LVMM (r = 0.61; p < 0.05) in patients with diabetes and hypertension. The increase in insulin resistance HOMA IR in the diabetes groups was accompanied by an increase in EDR (r = 0.74; p < 0.05), EDV (r = 0.63; p < 0.05) and LP (r = 0.67; p < 0 .05). An increase in IRI was accompanied by an increase in LVMM both in the diabetes and non-diabetic groups (from r = 0.31 to r = 0.52, respectively; p < 0.05).
Correlation relationships between LVMM, IRI and ABPM and metabolic parameters turned out to be dependent on the type of LVH remodeling. In concentric LVH, an increase in insulin and cortisol levels was accompanied by an increase in LVMM (r = 0.38 and 0.44; p < 0.05). An increase in pressure load time (SBP, IV SBP, IV DBP) also contributed to the development of LVCH.
In patients with eccentric LVH, myocardial mass depended on the abdominal obesity index (r=0.48; p<0.05). In these patients, we found a significant relationship between the levels of IRI and uric acid, cholesterol, and triglycerides (r = 0.64; r = 0.66; r = 0.51; p < 0.05).
Analysis of the data obtained allows us to conclude that insulin resistance affects the structural and functional parameters of the heart, both in patients with type 2 diabetes and in abdominal obesity. Thus, a positive relationship between the level of IRI and LVMM/MI was revealed both in patients with type 2 diabetes and without diabetes. It is also obvious that insulin resistance had a significant impact on the development of LVH, i.e. The higher the insulin resistance, the greater the LVMM value. However, the following features can be determined: in patients with type 2 diabetes, the effect of hyperinsulinemia and insulin resistance was determined by an increase in the structural parameters of the myocardium - the thickness of the LVAD and LVMM, i.e. the hyperplastic effect of insulin on the target organ was manifested. In patients without hypertension and diabetes, the effect of insulin and IR was manifested by an increase in the volumetric parameters of the myocardial cavities.
E.N. Smirnova
Perm State Medical Academy
Literature:
1. Ametov A.S., Demidova T.Yu., Tselikovskaya A.L. Obesity and cardiovascular diseases // Ter. archive. - 2001. - No. 8. - From 66-69.
2. Martynov A.I., Ostroumova O.D., Mamaev V.I. and others. Left ventricular myocardial hypertrophy in arterial hypertension: clinical significance, diagnosis, effect of antihypertensive drugs // Clinical Medicine. - 2000. - No. 10. — P. 10-17.
3. Konradi A.O., Zhukova A.V., Vinnik T.A. and others. Structural and functional parameters of the myocardium in patients with hypertension depending on body weight, type of obesity and state of carbohydrate metabolism // Arterial hypertension. - 2002. - T.8. - No. 1. — P.12-15.
4. Shlyakhto E.V., Moiseeva O.M. Cellular aspects of vascular remodeling in arterial hypertension // Arterial hypertension. - 2002. - No. 2. — P.45-49.
5. de Simone G., Palmieri V., Koren MJ et al. Prognostic implications of the compensatory nature of left ventricular mass in arterial hypertension // J. Hupertens. - 2001. - V.19. — P.119-126.
6. Gosse P., Jullien P., Jarnier P. et al. Echocardiographic definition of left ventricular hypertrophy in the hypertensive: with method of indexation of left ventricular mass? // J.Hum.Hypertens. - 1999. - V.13. — P.505-509.
7. Iacobellis G., Ribaudo MC Correlation between insulin resistance and left ventricular mass in uncomplicated obesity // Diabetologia. — 2001. -V.44. - A.701.
8. Kannel WB Left ventricular hypertrophy and regression. London, 1992.
9. Koren M, Devereux RB, Casale PN, Savage DD et al. Relation of left ventricular mass and geometry to morbidity and mortality in uncomplicated essential hypertension // Ann. Intern. Med. - 2001. - V.114. — P.345-352.
10. Moller DE, Flier J. Insulin resistance—mechanisms, syndromes, and implications // N. Engl. J. Med. - 2001. - V.26. — P.938-948.
