YES.
Kuzhel, G.V. Matyushin, T.D. Fedorova E.A., Savchenko, T.M. Zadoenko KGUZ "Krasnoyarsk Regional Hospital No. 2" GOUVPO "Krasnoyarsk State Medical Academy"
An electrocardiogram in 12 standard leads is the method of choice in the diagnosis of acute myocardial infarction (AMI). Quick and accurate diagnosis of AMI is vital, as it makes it possible to immediately begin reperfusion therapy, which reduces the area of necrosis and improves the patient's prognosis. One of the generally accepted criteria for myocardial infarction is ST segment elevation in two or more anatomically adjacent leads [10]. The importance of timely identification of ST segment elevation associated with AMI is emphasized by the fact that neither ST segment depression nor increased biochemical markers of cardiac necrosis (MCN) in the blood serum are indications for thrombolytic therapy [4, 9].
In the early stages of AMI, diagnosis can be significantly difficult, since the ECG is often normal or has minimal abnormalities. Moreover, only half of patients with AMI have obvious diagnostic changes on the first ECG. At the same time, approximately 10% of patients with proven AMI (based on clinical data and positive MCI) will not develop typical changes on the ECG, such as ST segment elevation or depression [4]. However, in most cases, serial ECGs in individuals with AMI show a characteristic evolution that usually corresponds to the typical changes observed in myocardial infarction. In the domestic school of cardiology, it is customary to distinguish four stages of the course of AMI [1].
I.
The most acute stage
. In this stage, which lasts from several hours to several days, changes in the ECG affect only the ST segment and the T wave. The earliest signs of acute myocardial infarction are difficult to distinguish and usually include an increase in the amplitude of the T wave in the affected area, which becomes symmetrical and directional ( hyperacute). Typically, hyperacute T waves are most evident in the anterior precordial leads and are most noticeable when an older ECG is available for comparison. Changes in T wave amplitude can be observed within a few minutes of the onset of infarction and are accompanied by corresponding changes in the ST segment. The optimal time for delivery of a patient to a medical facility is considered to be an interval of up to four hours from the onset of AMI. Unfortunately, ECG changes in the acute stage of myocardial infarction are often not properly assessed, which significantly increases the time it takes for the patient to be delivered to a specialized facility and prolongs the start of reperfusion therapy.
II. Acute stage.
In the acute stage, which usually lasts up to one week, ST segment elevation is recorded and Q waves begin to form. In practice, ST segment elevation is often the earliest sign of AMI and usually becomes noticeable within a few hours from the onset of symptoms. At the initial stages, the angle between the T wave and the ST segment, characteristic of a normal ECG, is lost. The T wave becomes wide and the ST segment rises, losing its normal concavity. During further ascent, the ST segment becomes convex upward. The degree of ST segment elevation varies between small changes of less than 1 mm to pronounced elevation of more than 10 mm. Sometimes the QRS complex, ST segment and T wave merge, forming the so-called monophasic curve.
III. Subacute stage.
The subacute stage of myocardial infarction lasts up to several weeks. During this stage, the ST segment begins to approach the isoline, and negative T waves are formed. In the case of transmural myocardial infarction, the necrosis process is accompanied by changes in the QRS complex, which include a decrease in the amplitude of the R waves and the development of pathological Q waves. Such changes develop as a result of the loss of viable myocardium under recording electrode, therefore Q waves are the only ECG criterion that verifies myocardial necrosis. Q waves can develop within 1 to 2 hours of the onset of AMI symptoms, although this often takes 12 to 24 hours. The presence of pathological Q waves, however, does not necessarily indicate a completed infarction. If ST segment elevation and Q waves are detected on the ECG and the chest pain is of recent onset, the patient may still benefit from thrombolysis or interventional therapy.
IV. Scar stage.
Consolidation of scar tissue ends on average 8 weeks after myocardial infarction. At this stage, the ST segment reverts to the isoline and the amplitude of negative T waves decreases. In the case of extensive myocardial infarction, pathological Q waves are a stable marker of cardiac necrosis. In small infarcts, scar tissue may include viable myocardium, which may reduce the size of the electrically inert region and even cause the eventual disappearance of Q waves.
One of the curious features of the ECG in AMI is the so-called pseudonormalization phenomenon. Wilson's theory of the formation of Q waves implies the formation of a so-called electrical window in case of necrosis, through which the recording electrode records the electrical potentials of the opposite wall. However, despite necrosis, some of the myocardial fibers in the infarction zone remain viable, which explains the characteristic flattening of Q waves during myocardial infarction. However, the potentials of these fibers remain hidden behind the powerful electric vector of the opposite wall. With a repeated infarction, which involves the opposite wall, this vector is significantly reduced, which, in turn, makes it possible to record the potentials of myocardial fibers in the area of the old scar. As a result, in the area of the old scar with pathological Q waves (for example, in the anterior wall), in the event of a re-infarction of the opposite wall (for example, the posterior wall), R waves begin to be recorded. Thus, the registration of R waves in the area where pathological Q waves were previously observed, strongly suggests the formation of an infarction in the opposite wall.
Dynamics of changes in the ST segment and T wave in AMI
The ECG picture during myocardial infarction has its own characteristic development. Firstly, ST segment elevation, as a rule, leads to the formation of Q waves. Secondly, the formation of negative T waves occurs against the background of a characteristic arcuate ST segment elevation.
ST segment elevation associated with myocardial infarction in the anterior wall can persist for a long time if dyskinesia or left ventricular (LV) aneurysm develops. Negative T waves can also persist for a long period and sometimes remain a permanent sign of myocardial infarction. It should be noted that the absence of formation or “restoration” of pre-inverted T waves in the acute stage of myocardial infarction strongly suggests the development of post-infarction pericarditis [11].
Myocardial infarction is a disease accompanied by necrosis of one or more areas of the heart muscle as a result of acute disruption of blood flow in the coronary arteries supplying the myocardium. Acute non-ST segment elevation myocardial infarction and ST-segment elevation myocardial infarction are types of acute coronary syndrome, which also includes unstable angina.
Myocardial infarction is the leading cause of death in most countries, including Russia. Timely hospitalization in many cases helps prevent irreversible damage to the heart muscle, but often patients misjudge the symptoms that arise and try to cope with them on their own, which leads to late consultation with a doctor. Therefore, in case of acute chest pain or other alarming symptoms, it is necessary to consult a specialist as soon as possible.
The risk of myocardial infarction increases with age; people over 60 years of age are more likely to get sick. However, recently the number of early myocardial infarctions has increased - in people under 40 years of age. Among patients under 70 years of age, men predominate, but after 70 years, the number of men and women with myocardial infarction becomes the same. This may be due to the protective effect of estrogens (female sex hormones), which reduce the likelihood of atherosclerosis, the main risk factor for heart attack.
The prognosis of myocardial infarction depends on the extent of damage to the heart muscle, the presence of concomitant diseases, the time of seeking medical help and the age of the patient. The mortality rate for acute myocardial infarction reaches 30%.
Synonyms Russian
Heart attack, MI.
English synonyms
Heart attack, acute myocardial infarction, MI, myocardial infarction.
Symptoms
The main symptom of acute myocardial infarction is sharp chest pain, which most often feels like a sharp squeeze. It usually lasts longer than 15 minutes and is not relieved by taking nitroglycerin. The pain may spread to the left shoulder, shoulder blade, neck, lower jaw, and may be accompanied by cold sweat, nausea and vomiting, and loss of consciousness. In some cases, the pain has an atypical localization - in the abdomen, spine, left or even right arm.
Sometimes a heart attack is preceded by nonspecific symptoms: for several days before a heart attack, a person may feel weakness, malaise, and discomfort in the chest area.
A heart attack may not be accompanied by a characteristic pain syndrome and may manifest itself only by such symptoms as shortness of breath, rapid heartbeat, weakness, and nausea. Subtle symptoms of myocardial infarction are especially common in women.
Thus, the main symptoms of acute myocardial infarction are:
- chest pain,
- dyspnea,
- cold sweat,
- feeling of fear,
- loss of consciousness,
- nausea, vomiting.
General information about the disease
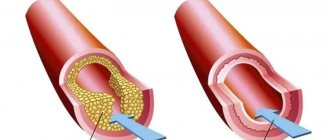
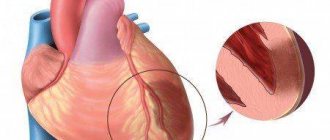
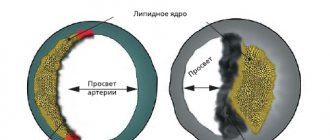
Myocardial infarction develops as a result of impaired blood supply to the heart muscle, which leads to a lack of oxygen and nutrients and necrosis (death) of the myocardium. The main cause of impaired blood flow in the vessels supplying the myocardium is atherosclerosis of the coronary arteries - the deposition of atherosclerotic plaques, consisting mainly of cholesterol, on the inner surface of the vessels. Then there is a proliferation of connective tissue (sclerosis) of the vessel wall and the formation of calcium deposits (calcification) with further deformation and narrowing of the lumen of the vessel until complete blockage. Subsequently, the so-called aseptic inflammation can develop in the atherosclerotic plaque, which, when exposed to provoking factors (physical activity, increased blood pressure, etc.) can lead to plaque rupture. In the area of damage, platelets accumulate, biologically active substances are released, which further enhance the adhesion (clumping) of blood cells, and as a result, a blood clot is formed, clogging the lumen of the coronary artery. Increased blood clotting also contributes to the formation of a blood clot. If blood flow in the vessels is not restored in the next six hours, irreversible changes occur in the myocardial tissue.
Rarely, myocardial infarction occurs with a sharp spasm or thromboembolism of pathologically unchanged coronary arteries, but this is observed only in 5% of cases.
Most often, myocardial infarction is localized in the anterior wall of the left ventricle, less often in the posterior wall of the left ventricle and the interventricular septum. Right ventricular infarction is rare. Transmural and subendocardial myocardial infarction are distinguished. With transmural pathological changes affect the entire wall of the heart, with subendocardial – from? up to ½ wall thickness. There is also a division into myocardial infarction without ST segment elevation and myocardial infarction with ST segment elevation. The presence of ST segment changes on the electrocardiogram suggests complete occlusion of the coronary artery and extensive myocardial damage with a higher risk of developing irreversible tissue necrosis. ST segment elevation is not observed when the artery is partially blocked - this may indicate myocardial infarction without ST segment elevation or unstable angina. However, only during myocardial infarction does the activity of cardiac enzymes change.
When the blood supply to the myocardium is disrupted, cell death begins, first of all, in the endocardium, and then the damage zone spreads towards the pericardium. The extent of the lesion depends on the degree of blockage of the artery, its duration, and the collateral circulatory system.
Necrosis in the tissues of the heart muscle causes acute pain. Extensive myocardial damage can lead to impaired contractile function of the heart, which is manifested by acute left ventricular failure with the development of pulmonary edema and cardiogenic shock. Cardiogenic shock, in turn, aggravates the course of myocardial infarction due to deterioration of coronary circulation. The result is severe heart rhythm disturbances, including atrial fibrillation.
Transmural infarction in some cases can lead to rupture of the heart wall or to an aneurysm - local thinning and protrusion of a section of the myocardium.
Who is at risk?
The main cause of myocardial infarction (up to 90% of all cases) is atherosclerosis. Therefore, risk factors for the development of atherosclerosis increase the likelihood of developing a heart attack. The risk group includes:
- men over 45 years of age and women over 65 years of age,
- suffering from obesity, dyslipidemia, arterial hypertension, diabetes mellitus,
- people whose relatives suffer from cardiovascular diseases and/or have suffered a myocardial infarction,
- smokers,
- leading a sedentary lifestyle,
- drug users (cocaine, amphetamines can provoke spasm of the coronary arteries),
- experiencing severe stress.
Diagnostics
Acute myocardial infarction in many cases is asymptomatic or atypical, which makes its diagnosis difficult. There are a number of diseases, the manifestations of which can often be similar to those of a heart attack: aortic aneurysm, angina pectoris, liver and biliary tract diseases, depression, esophagitis and others. Therefore, if a myocardial infarction is suspected, it is necessary to conduct a series of laboratory and instrumental studies to distinguish myocardial infarction from other pathologies and identify the extent and localization of damage, the duration of ischemia, and post-infarction complications. In addition, it is important to recognize the signs of concomitant diseases: pathology of the kidneys and respiratory system, diabetes mellitus, anemia. All this determines the further treatment regimen and prognosis of the disease.
Laboratory diagnostics
- General blood analysis. In acute myocardial infarction, leukocytosis may be observed. The number of leukocytes increases from the second hour after the onset of circulatory disorders and reaches a peak on the 2-4th day. It is important to pay attention to the number of red blood cells, since anemia worsens oxygen starvation of the heart muscle.
- Leukocyte formula. Leukocytosis with a shift of the leukocyte formula to the left and aneosinophilia is possible.
- Erythrocyte sedimentation rate (ESR). An increase in ESR indicates an acute inflammatory process.
- Troponin I (quantitatively) is a protein that is involved in muscle contraction. During a heart attack, its level usually increases starting from the 4-6th hour, maximum on the 2nd day, and normalizes within 6-8 days from the onset of the disease.
- Myoglobin. This is a protein found in muscle tissue, including the myocardium. During myocardial infarction, myoglobin levels increase within 4-6 hours.
- Alanine aminotransferase (ALT) and aspartate aminotransferase (AST). During myocardial infarction, the level of these enzymes is an indicator of the extent of damage to the heart muscle.
- Creatine kinase MB. An increase in its concentration is specific to damage to the heart muscle. Its level increases from the first hours and remains elevated for 2-3 days.
- General lactate dehydrogenase (LDH) is an enzyme that is found in almost all cells of the body and is involved in the utilization of glucose. The level of LDH increases with myocardial infarction, pathology of the liver, blood, and kidneys. During myocardial infarction, it remains elevated for 10-14 days.
- Lactate dehydrogenase 1, 2 (LDH, 1, 2 fractions). Forms of the enzyme lactate dehydrogenase, which are found mainly in the cells of the heart, renal cortex, and liver. These indicators can be used to assess the extent of damage during myocardial infarction.
- Antithrombin III. Synthesized in vascular endothelial cells and liver cells, it is involved in the inactivation of a number of blood coagulation factors. A decrease in the amount of antithrombin III indicates an increased risk of thrombosis. Its level is reduced in thromboembolism and atherosclerosis.
- Lupus anticoagulant screening test (LA1). Lupus anticoagulant is a complex of antibodies against phospholipids. Their presence may indicate autoimmune diseases and is also a sign of an increased risk of blood clots.
- Prothrombin index (PI), international normalized ratio (INR). The analysis is used to evaluate the extrinsic coagulation pathway and the activity of coagulation factors I, II, V, VII, and X. Hypercoagulability increases the risk of blood clots. During myocardial infarction, the prothrombin index may be increased.
- Glycated hemoglobin (HbA 1c, glycosylated hemoglobin, glycohemoglobin). Formed when glucose joins hemoglobin. This indicator allows you to estimate the amount of glucose in the blood over the last 120 days - this is the average lifespan of a red blood cell. A high level of glycated hemoglobin indicates a high glucose concentration over the past three months and indicates a high likelihood of complications of diabetes mellitus, which, in turn, increases the risk of myocardial infarction. The glycated hemoglobin test is used to assess the effectiveness of treatment and prognosis of myocardial infarction in patients with diabetes mellitus.
- Plasma glucose. Also used to diagnose diabetes.
- Iron in serum. Iron is part of cytochromes and is involved in cellular respiration. During myocardial infarction, iron levels may be elevated.
- Serum electrolytes. In acute myocardial infarction, the levels of sodium, potassium, magnesium, calcium, and chlorine may change. However, this does not always happen; with uncomplicated myocardial infarction, the level of electrolytes may not change.
- Serum uric acid. When the blood supply to the myocardium is disrupted, necrosis of cardiac muscle cells occurs with the breakdown of organic substances and the release of breakdown products, including uric acid. This, in turn, provokes the development of inflammation in the area of myocardial damage. Thus, uric acid levels may be elevated in large myocardial infarction.
- C-reactive protein, quantitative. During myocardial infarction, it is increased due to the inflammatory reaction.
- Triglycerides. Formed in the intestines from dietary fats. They are deposited in adipose tissue and consumed by cells as needed to obtain energy. Elevated triglyceride levels may indicate a high risk of atherosclerosis.
- Total cholesterol. These are compounds that are involved in the formation of atherosclerotic plaques. Its concentration can be increased during myocardial infarction resulting from atherosclerosis of the coronary arteries.
- Cholesterol – high-density lipoproteins (HDL) – is a fraction of total cholesterol that prevents the formation of atherosclerotic plaques.
- Cholesterol – low-density lipoproteins (LDL) is a fraction of cholesterol involved in the formation of atherosclerotic plaques.
- Cholesterol – very low density lipoproteins (VLDL). These are lipoproteins that are formed in the liver. They are carriers of phospholipids, triglycerides, and cholesterol. When released from the liver into the blood, they undergo chemical transformations with the formation of low-density lipoproteins
- Atherogenic coefficient. This is the ratio of “harmful” (LDL, VLDL, triglycerides) and “beneficial” lipoproteins (HDL). An increase in the atherogenicity coefficient indicates a high risk of developing atherosclerosis.
Other research methods
- Electrocadiography (ECG). Allows you to confirm the diagnosis of “myocardial infarction”, determine the location and degree of damage to the heart muscle, and identify signs of heart rhythm disturbances.
- X-ray of the chest organs. Used to detect cardiac aneurysm.
- Ultrasound examination of the heart. Allows you to identify the area of myocardial damage and evaluate the contractility of the heart.
Treatment
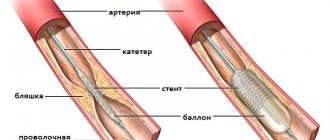
Therapy is prescribed individually depending on the patient’s age, the severity of the condition and the extent of damage to the heart muscle. Of great importance is the restoration of blood supply to the myocardium during the first 12 hours after the appearance of the first signs of myocardial infarction. This may prevent or reduce the degree of tissue necrosis. The main directions of therapy for acute myocardial infarction are pain relief, thrombolytic and anticoagulant therapy, reducing the load on the myocardium, prevention and treatment of complications that arise.
Prevention
Eat a healthy diet low in saturated fat and plenty of vegetables and fruits.
Sufficient physical activity.
Quitting alcohol and smoking.
Timely completion of preventive medical examinations to identify diseases that increase the risk of developing myocardial infarction.
Recommended tests
- General blood analysis
- Leukocyte formula
- Erythrocyte sedimentation rate (ESR)
- Troponin I (quantitative)
- Myoglobin
- Alanine aminotransferase (ALT)
- Aspartate aminotransferase (AST)
- Antithrombin III
- Lupus anticoagulant screening test (LA1)
- Coagulogram No. 1 (prothrombin (according to Quick), INR)
- Glycated hemoglobin (HbA 1c)
- Plasma glucose
- Serum iron
- Potassium, sodium, chlorine in serum
- Creatine kinase MB
- Lactate dehydrogenase (LDH) total
- Serum uric acid
- C-reactive protein, quantitative
- Triglycerides
- Total cholesterol
- Cholesterol – high density lipoprotein (HDL)
- Cholesterol – low density lipoproteins (LDL)
- Cholesterol – very low density lipoproteins (VLDL)
- Atherogenic coefficient
- Laboratory diagnosis of acute coronary syndrome and myocardial infarction (optimal)
- Laboratory diagnosis of acute coronary syndrome and myocardial infarction (minimal)
- Laboratory examination of the heart and blood vessels
Reciprocal ST segment depression
ST segment depression in leads opposite the affected area, otherwise known as reciprocal depression, is a highly sensitive indicator of AMI. The pathogenesis of reciprocal changes remains unknown. Reciprocal changes have high sensitivity and a positive predictive value of up to 90% and are observed in approximately 70% of lower and up to 30% of infarcts involving the anterior wall of the LV, although, of course, their absence does not exclude the diagnosis of AMI [4, 5]. As a rule, ST segment depression is horizontal or oblique. The presence of reciprocal changes is especially important when there is doubt about the clinical significance of the recorded ST segment elevation. We especially note that reciprocal changes may be the only sign of AMI against the background of still unobvious ST segment elevation. Similar situations often occur in cases of myocardial infarction with damage to the lower wall. The presence of severe ST segment depression in the precordial leads against a background of normal heart rate or bradycardia in a patient with an ischemic painful attack strongly requires the exclusion of AMI.
Myocardial infarction of the anterior wall
Anteroseptal ST-segment elevation infarction in leads V1-V3 is a highly accurate indicator of left anterior descending coronary artery (LADCA) involvement. ST segment elevation in these three leads and in lead aVL, combined with ST segment depression of more than one mm in lead aVF, indicates occlusion of the proximal segment of the LCA. ST-segment elevation in leads V1, V2, and V3 without significant ST-segment depression in the inferior leads suggests occlusion of the LCA after origin of the first diagonal branch.
In some cases, the LPNCA wraps around the apex of the LV and supplies blood to the apical parts of the inferior wall in the distal part of the posterior interventricular groove. Rarely, the LCA extends along the entire length of the posterior sulcus, replacing the posterior descending artery. In the case of ST segment elevation in leads V1, V2 and V3 with ST elevation in the inferior leads, occlusion of the LCA of the distal origin of the first diagonal branch, in the area that irrigates the inferoapical parts of the LV, can be assumed [7].
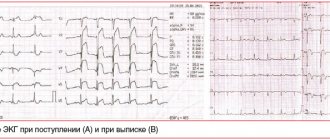
What does a cardiogram show during a heart attack?
Electrocardiography (ECG) is a test performed first when a myocardial infarction is suspected. Based on the recorded cardiogram, several conclusions can be drawn:
1. The area of the dead zone located in the thickness of the heart muscle is indicated by a change in the QRS complex . Usually this part increases or a pathologically high Q wave .
2. About the place around the formed necrosis, which is affected by the displacement of the ST segment .
3. About the ischemic zone, which is located even further from the point of injury. An electrocardiogram records a violation of the myocardial restoration processes in the form of changes in the T wave .
The concept of ST segment elevation: above without atrial repolarization, below with atrial repolarization without QRS
During an ECG, each lead is recorded on the film with a new line, which helps to accurately determine the location of the cardiac lesion. In total, the electrocardiogram consists of 12 graphic lines and 5 teeth - P, Q, R, S, T. Each tooth is distinguished by its width, height, depth and goes in its own direction.
projection of ECG leads
projection of ECG leads
The dynamics of the development of a heart attack on the ECG become visible in the first minutes after the development of the disease. On the film, changes are displayed depending on the shape of the infarction, its location and stage of progression. They can be barely noticeable (with small focal lesions) or have a clear “classical” form, known to all literate people.
Lower IM
AMI with isolated ST-segment elevation in leads II, III, and aVF is usually associated with damage to the right coronary artery (RCA) or the distal circumflex artery (CA). A rather unpleasant feature of AMI with damage to the inferior wall is that the ST segment elevation associated with the infarction can develop over a long period, up to two weeks, to become evident on the ECG [4]. The inferior wall can be supplied with blood from the right coronary artery (in 80% of cases) or from the OA, which is a branch of the left coronary artery.
ST segment elevation in lead III is greater than in lead II, and ST segment depression of more than one mm in leads I and aVL suggests damage to the RCA, which supplies the inferior wall. In the case of blood supply to the lower wall from the OA, the rise of the ST segment in lead III does not exceed the rise in lead II. In this case, either an elevation of the ST segment in aVL is observed, or it is located on the isoline [6, 7].
ECG picture depending on the stage of infarction
Zones of myocardial ischemia on the ECG
When the blood supply to any part of the heart muscle is cut off, muscle cells in that area die. At the edges of the myocardial ischemia zone, the cells of the conduction system do not die, but their performance is impaired. After the blood supply is restored, the functioning of the damaged tissues usually returns to normal. That is, this is the area that can be saved with early endovascular intervention. These functions are displayed depending on the stage and strength of MI development. They are divided into:
- acute;
- spicy;
- subacute;
- cicatricial
There are only two types of lesions: small-focal and large-focal infarction (a severe version of large-focal infarction is transmural infarction). Large-focal MI is called a “Q-forming infarction.”
Right ventricular myocardial infarction
Right ventricular MI is usually associated with occlusion at the level of the proximal RCA. The most sensitive ECG sign of right ventricular MI is ST segment elevation of more than one mm in lead V4R with a positive T wave in this lead [5]. This sign is rarely observed more than 12 hours after AMI, so right leads should be recorded as soon as possible in all patients with inferior wall infarction. On a standard 12-lead ECG, signs of AMI involving the right ventricle are ST segment elevation in lead V1 combined with ST segment elevation in leads II, III, and aVF (STIII greater than STII).
Right ventricular infarction is often missed because the standard 12-lead ECG does not have high sensitivity for right ventricular infarction. At the same time, the diagnosis of right ventricular infarction is important, as it may be associated with a state of hypotension caused by treatment with nitrates or diuretics. At the same time, in contrast to cardiogenic shock, which requires differential diagnosis, the patient responds well to fluid administration.
In approximately 40% of cases, inferior wall AMI is complicated by right ventricular infarction [2, 6]. Less commonly, right ventricular infarction is associated with occlusion of the circumflex artery and, if this branch is dominant, may be associated with inferolateral infarction. Right ventricular infarction can complicate anterior wall AMI and can rarely occur as an isolated phenomenon [15].
Features of the procedure
An ECG shows ischemia, angina, arrhythmia and other pathologies of the heart muscle in both adults and children. The study is carried out at rest, although studying changes in some indicators requires a small load. An ECG will also show heart failure. When carrying out the procedure in children, it should be taken into account that their normal values will differ from the established limits for adults.
To obtain accurate data from the results of an electrocardiogram, you should trust your heart to be checked by qualified specialists and have it done in specialized institutions. They are in every city. In the city of Bronnitsy, the Immunity MC conducts similar cardiological studies.
Cost and appointment
Myocardial infarction of the posterior wall
The posterior descending coronary artery (PDCA), which supplies blood to the posterobasal sections, can be a branch of the RCA (in 85-90% of cases) or a branch of the OA (12), which determines the right or left type of coronary circulation. The diagnosis of AMI with posterior-basal lesions is often difficult when using a standard 12-lead ECG, while early detection of coronary thrombosis is very important from the point of view of prescribing thrombolytic therapy.
Changes in the ECG during AMI of the posterior basal sections are indirectly manifested in the anterior precordial leads. Leads V1-V3 record the potentials of not only the anterior, but also the opposite (posterior) wall, and changes in blood supply in this area are reflected in these leads. Typically, there is an increase in R waves that become wider and more dominant, as well as ST segment depression and high amplitude T waves pointing toward the posterior wall [3]. The use of leads V7-V9, recording posterobasal potentials, will show ST segment elevation in patients with AMI.
These additional leads provide valuable information and help in identifying patients who may benefit from urgent invasive therapy. In any case, registration of ST segment depression in leads V1-V2 should serve as a reason to exclude AMI of the posterobasal parts of the LV. In the cicatricial stage, a previous myocardial infarction in the posterior-basal sections will be indicated by the ratios R/S > 1 in lead V2 and RV2 > RV6, recorded against the background of the horizontal position of the electrical axis of the heart [2].
Lateral wall infarction.
Lesions in the proximal circumflex artery are often associated with lateral infarction and changes in leads I, aVL, V5-V6. Often, AMI can manifest itself as changes that occur isolated in lead aVL. In such cases, it is customary to diagnose AMI with damage to the high lateral parts of the LV [3].
conclusions
The disease described is an extremely serious and life-threatening pathology. A person’s life depends on its timely diagnosis and treatment. Therefore, people should be very careful about their health and seek emergency help if symptoms of myocardial infarction appear. The examination of such a patient necessarily begins with an ECG. If latent forms are suspected, a cardiogram is taken in additional leads. If a patient who has previously suffered a heart attack has clinical signs of such a pathology, then a repeat episode of the disease is suspected. But often on the ECG, due to the scar from previously suffered atherothrombosis, new changes may not be seen. In such situations, additional research methods are used to determine markers of MI in the blood.
ECG predictors of reperfusion
Pathogenetic therapy for AMI has the goal of restoring blood flow in the affected artery. Lack of restoration of blood flow (reperfusion) is the most powerful predictor of the development of LV systolic dysfunction and the risk of death after AMI. In the absence of reperfusion, 30-day mortality can reach 15% [14]. In turn, the resolution of ST segment elevation is an indicator of improved short-term (30-day) and long-term (one-year) prognosis [5]. Assessing ST segment resolution is also useful for deciding on further management of the patient.
Failure to resolve the ST segment within the first 90-120 minutes after thrombolytic administration should be a reason to consider angioplasty. A specific marker of reperfusion that has occurred is considered to be a reduction in ST segment elevation by more than 50-70% in the lead with maximum elevation, which is associated with the most favorable further prognosis. At the same time, a number of authors propose a criterion of 50% reduction in ST segment elevation after 60 minutes of reperfusion therapy as a predictor of a good prognosis in individuals with AMI [13]. Considering that the maximum effect from subsequent angioplasty after thrombolysis is achieved no later than 6-8 hours from the onset of AMI [14], reducing the time for assessing reperfusion has good reason.
Other ECG markers of reperfusion include T wave inversion within four hours of AMI onset. T wave inversion, which occurs within the first hours of reperfusion therapy, is a highly specific sign of restoration of blood flow. T wave inversion, which develops after more than four hours, is associated with natural ECG dynamics during AMI and does not indicate restoration of blood flow. Accelerated idioventricular rhythm 60-120 beats/min, late, paired, ventricular extrasystoles are also a highly specific marker of reperfusion. These rhythms are considered not dangerous and, as a rule, do not require antiarrhythmic therapy. Polymorphic ventricular tachycardia and ventricular fibrillation can also be associated with reperfusion, but are rare and more often a consequence of persistent coronary occlusion.
Typical dynamics of the stages of infarction on the ECG
1. The most acute stage lasts 3 - 72 hours. During this time, the formation of necrosis and the Q wave may occur. Elevation of the ST segment outside the isoline is observed. The most acute stage can be recognized by the formation of a monophasic curve (cat's back).
ST segment elevation on ECG
2. The acute stage lasts 14-20 days. It is characterized by a clear localization of the ischemic zone and existing damage. In case of AMI, the ST segment comes close to the isoline and covers the T wave.
3. The subacute phase can last up to three months. The damaged area is replaced by connective tissue. The patient's condition is stabilized. When repeating the ECG, ST elevation to the isoline is recorded.
4. The scar stage is the stage of formation of a strong connective tissue scar. In other words, this is a scar that will not disappear for the rest of your life. When deciphering the ECG tape, the ST segment does not go beyond the isoline. During scarring, the amplitude of the T wave should not exceed 5 mm, and it is also important that its height does not reach the middle of Q and R in the same lead. An old scar of unknown date is recorded on the ECG tape in the form of a scar.
MI can be large-focal or small-focal. This takes into account how extensive the area of damage to the heart muscle is.
transmural Q infarction ECG - stages of development