If a local area of the heart muscle fails to work (necrosis, hibernation, sclerosis, stunning), this is manifested on the ECG by the appearance of a pathological Q wave.
A Q wave is considered pathological if its duration exceeds 0.03 s and its amplitude is greater than 1/4 of the R wave. An exception is lead aVR.
Changes in “pathological waves” must be present in two adjacent leads (for example V1+V2, V5+V6, AVL+I, etc.)
If a pathological Q is suspected in lead III, then it should be duplicated in lead aVF and not disappear with a deep breath!
Scar changes cannot be judged in the presence of left bundle branch block
In fact, these are the main criteria and now we will analyze them in more detail.
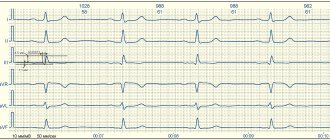
EXAMPLE 1
When assessing the ventricular complexes, we notice a more or less pronounced QIII wave. We measure its width and height. As you can see, its width approaches 0.03 s., but does not exceed the norm, we also see that its amplitude (height) is about 1-1.1 mm, which is less than 1/4 of the R wave, which is equal to 4. 5 mm. We also see that in lead aVF the Q wave also falls within the normal range.
Thus, we conclude that these are not scar changes.
What disorders may these cardiac examination results indicate?
At CELT you can consult a cardiologist.
- Initial consultation – 3,500
- Repeated consultation – 2,300
Make an appointment
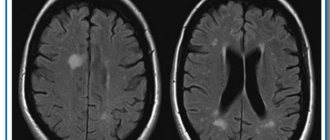
Diffuse changes in the heart muscle on an ECG may mean:
- The absence of any pathology is a variant of the norm;
- Inflammation of the heart muscle, that is, myocarditis;
- Metabolic disorders in the heart muscle, for example hormonal;
- The process of gradual replacement of myocardial muscle fibers with connective tissue cells, resulting from inflammatory or metabolic disorders (cardiosclerosis);
- Disturbances of water-salt metabolism in the body in general and in the myocardium in particular;
- Exposure to certain medications.
It is also necessary to remember that the severity of diffuse changes can be quite insignificant. In such cases, the diagnostic results of the cardiovascular system can often be due only to age-related changes in the myocardium.
EXAMPLE 2
Here is another Q in the same lead III. But here, after measurements, we see that its amplitude is not just 1/3 or 1/2 R, but almost equal to it - this is not the norm. In addition, the duration (width) of 0.04 s also goes beyond what is permitted. In the adjacent lead aVF, the Q wave is also pathological - it has a height of 1/3 R and a width of about 0.04 s. This gives us every right to talk about scar changes in the posterior wall (this is the area controlled by these leads)
EXAMPLE 3
The first complexes were recorded with little interference, so we pay attention to the second and third complexes in sections V1-V3. The red frame shows an example of what the complexes in these leads should look like normally.
The morphology of V1 here is not very different from the norm, but V2 and V3 are distinguished by the absence of R waves. After a short isoline following the P wave, a deep negative wave begins (which, as you know, is called Q). The Q wave is jagged, which is characteristic of cicatricial changes. More attentive people have already noticed that “pathological Q” is also present in lead V4. If it is carefully measured, its parameters will be outside the normal range. In addition, there should not be such an obvious Q in this lead.
Thus, here we are talking about cicatricial changes in the anteroseptal region.
EXAMPLE 4
Here we see a similar picture, only the Q waves are so pronounced that it can be confusing.
After the P wave there is immediately a negative wave, which cannot be anything other than a Q wave. Here the Q wave is pathological (given the duration and amplitude). That is, here we are talking about cicatricial changes in the anteroseptal-apical region. The fact that there are no scar changes in lead V6 does not allow us to talk about lateral localization, although in this patient it is necessary to make sure that the electrodes are applied correctly; perhaps V6 is not in place and then the scar zone will expand to the lateral wall.
In such doubtful cases, I recommend that you describe what you see - pathological Q waves in leads V1-V5 and therefore “tie” them to the walls of the heart.
Myocardial fibrosis as the main substrate of tachyarrhythmias
Academician Ivashkin V.T.: – I give the opportunity to present my idea of myocardial fibrosis as the main substrate of tachyarrhythmia to Oksana Mikhailovna Drapkina. Please, Oksana Mikhailovna.
Professor Drapkina O.M.: – My lecture will be mainly devoted to such a small section of myocardial fibrosis, namely myocardial fibrosis as the basis of tachyarrhythmias in patients with arterial hypertension. That is, arterial hypertension through fibrosis, a ligament with atrial fibrillation, something that I would like to reflect to a greater extent in my lecture today.
Probably, the chosen topic is not accidental, since arterial hypertension was, is and will be, and its prevalence is sufficient. We, of course, occupy one of the leading places, but still the situation is far from ideal both in the USA, and in England, and simply in Europe. We also have certain successes, but, nevertheless, it is too early for us to stop there.
Today I will say a little more about the path that every patient goes through, starting from an increase in blood pressure, seemingly at first episodic, seemingly harmless, and then to atrial fibrillation. It is no secret that arterial hypertension makes up the largest percentage in the genesis of the causes of atrial fibrillation.
If we look at this adapted diagram, we see that atrial fibrillation, fibrosis plays the role of initiating atrial fibrillation, and at the same time it plays the role of one of the components of the so-called atrial disease or atriomegaly. And this atrial disease often manifests itself with supraventricular rhythm disturbances and fibrosis in the atria, which, in turn, leads to disruption of the conduction of the electrical impulse, because the impulse begins to take such a Z-shaped course; to a decrease in the contractile function of the left ventricle, including during sinus rhythm. And we often see such patients with arterial hypertension, chronic heart failure, and preserved ejection fraction.
Back in 2005, Academician Ivashkin gave a definition of atrial disease, and at that time atrial disease was described as a primary or secondary pathology of the atria, which manifests itself with atriomegaly, various rhythm and conduction disorders and symptoms of circulatory failure.
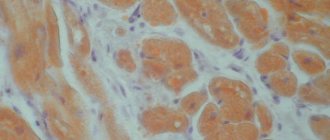
Today I will focus more on atriomegaly in a patient with arterial hypertension and the role of fibrosis in it. As I already said, fibrosis is one of the very first manifestations of atrial disease, in our opinion, and here not only, for example, the influence of angiotensin II, but also mechanical stretching plays a big role. Angiotensin II stimulates the growth factor TGFβ, and, as can be seen in this diagram, it is probably easier to prevent the initial manifestation of fibrosis when a hypertensive patient comes to us first, just with high blood pressure numbers and not so pronounced structural changes in the heart. Fibrosis as the morphological basis of tachyarrhythmias - I really liked this picture, it shows a section of the pulmonary vein near its mouth, and in blue the bundles that surround the fibrous connective tissue and are woven into the pulmonary vein are shown. And therefore, many studies have proven that an increase in the level of markers of myocardial fibrosis correlates with the risk, for example, of sudden death in such patients. Therefore, the profibrotic “bundle” is quite obvious - angiotensin II and transforming growth factor, when angiotensin II not only acts on TGFβ and affects myocardial fibrosis, and this action extends beyond the activation of collagen alone. This interaction leads to the fact that fibroblasts transform or turn into myofibroblasts, which are largely responsible for the secretion of extracellular matrix proteins. And now fairly new data indicate that not only this cytokine itself is activated, but also the connective tissue growth factor. And, in addition, angiotensin II sharply reduces the activity of type 1 matrix metalloproteinase, which is also responsible for myocardial fibrosis.
And again I turn to the lecture of Academician Ivashkin, this also took place in 2008. Here, when he spoke about atrial disease, he classified all the factors that influence structural and functional remodeling into correctable and non-correctable factors. Today I will focus only on arterial hypertension; it is indicated in yellow as one of the important correctable factors. I would like to share the experience that our clinic and our department have acquired in the treatment of such patients with fibrosis and arterial hypertension.
Thus, these schemes indicate that, after all, “typical” antiarrhythmics are not always good or not always good alone in treating a patient with arterial hypertension, atrial fibrosis and paroxysmal atrial fibrillation. Class 1C drugs, at a minimum, do not reduce patient mortality, and in some studies even slightly increase it. Today there was a lecture by Professor Doshchitsin, who showed all the side effects of amiodarone, which are also well known to us. We know that this is associated with certain side effects, well, and the promising drug dronedarone also, in general, has not shown its advantages, for example, compared to amiodarone, so amiodarone remains our lifesaver, the pill that is the first choice. a hand reaches out to treat paroxysmal fibrillation.
Accordingly, we can say that a new approach is needed. Probably the first point of this possible approach is the creation of agents that selectively act on the atria; this is still the future. Treatment of systemic disorders (hypertension, heart defects and other changes) is real, we know how to do it. And the use of “atrioprotective” properties of cardiac drugs. In fact, this is not a new class of cardiac drugs; much of what we use has atrioprotective properties. And in the first place here I put angiotensin-converting enzyme inhibitors, since angiotensin-converting enzyme inhibitors, which have proven themselves to be excellent drugs of choice for arterial hypertension, as drugs of choice for chronic heart failure, now have an increasing evidence base as a drug of choice for atrial fibrillation. There are many reasons for this. Firstly, the clinician and our patient benefit from atrial unloading, that is, a reduction in preload in patients with rigid myocardium when treated with angiotensin-converting enzymes. Antifibrotic and anti-inflammatory effects. Influence on electrophysiological effects and prevention of atrial remodeling, as well as quite modest, but still pronounced antisympathetic activity.
In the 2010 European Society of Cardiology guidelines on how to manage patients with atrial fibrillation, we see that ACE inhibitors and angiotensin receptor blockers come first in primary prevention, as this leads to a reduction in the development of atrial fibrillation by 30-45% compared to placebo. And the same ratio is observed in patients with arterial hypertension and left ventricular hypertrophy. The potential of statins is also very high, but here you need to know that statins have a dual effect on fibrosis. There is evidence that they somewhat reduce fibrosis in the myocardium, and fibrosis in the atherosclerotic plaque, on the contrary, is somewhat activated.
And here is also the data that was published in the journal (the footnote is shown on the slide). Indeed, fibrosis is reduced with the use of blockers of the renin-angiotensin-aldosterone system, and the first in this slide is lisinopril, and we see that a 9% reduction in fibrosis (this is experimental work) is observed after six months. Next comes perindopril - they have been monitoring the models here for 12 months. And losartan – also for 12 months, we also see a significant reduction in myocardial fibrosis.
Let's go back to our realities and see what a standard Russian patient is like. These are patients of our clinic. It’s not that we were looking for them, we just walked through the wards. This is arterial hypertension, this is often metabolic syndrome or obesity, about a third of patients, 30% (statistics speak of this, not only Russian, but also worldwide) are patients with preserved ejection fraction, with rigid myocardium. Therefore, there is every reason to choose angiotensin-converting enzyme inhibitors, which affect all the changes that may be observed in a patient with this cluster of diseases that were presented on the previous slide. The motivating factor was the study, the results of which I presented a few slides ago, where there was lisinopril, where there was perindopril, where there was losartan. And we decided to see how effective lisinopril is, or less effective, compared to perindopril in terms of reducing the level of both systolic and diastolic pressure and to look at indirect signs by which one can judge atrial fibrosis, namely, by the volume of the left atrium, according to the contractile function of the left atrium. We set a goal to compare the effectiveness of lisinopril as monotherapy and as fixed combinations with the same, similar combinations of perindopril in patients with arterial hypertension. The design of this study is presented here; 100 patients with high-risk arterial hypertension were screened; patients aged 18 to 65 years; Where possible, previous antihypertensive therapy was discontinued. The study included 72 patients, 38 in the lisinopril group and 34 in the perindopril group. There were 4 visits, the last visit ended after 12 weeks, and you see, dear colleagues, that we examined not only the dynamics of blood pressure levels, we tried to look at the change in the thickness of the intima-media complex, for which we did an ultrasound scan of the carotid arteries. Naturally, 24-hour blood pressure monitoring was used to evaluate the lipid profile and insulin resistance indicators. Today I will present only some data from this study.
I have already said the inclusion criteria, I will not dwell on them, as well as on the exclusion criteria - this is any unstable disease that could prevent or prevent us from treating the patient according to this design. The research methods were generally clinical, blood insulin, the HOMA test were determined for everyone, we also determined the Quike test, but we realized that it was more convenient for us to rely on the HOMA test. Electrocardiographic study, as I already said, ultrasound of the carotid arteries and a detailed echocardiographic study with assessment of diastolic function. Here is a portrait of our patients, average age – 50; both men and women; they have suffered from arterial hypertension for quite a long time, six and a half years; blood pressure upon inclusion in the study was 161/95. You see, dear colleagues, that almost 85% - 83.3% of patients had dyslipidemia, they had high levels of low-density lipoprotein cholesterol, 11% had diabetes mellitus, these were obese patients, the average body mass index was 33 kilograms per meter squared. These patients not only had hepatic steatosis, but also 36% had non-alcoholic steatohepatitis.
And here are the initial parameters of echocardiography in these patients. Firstly, I want to draw your attention to the fact that the myocardial mass was, on average, 219 grams, which is more than normal. They had very mild, but still symmetrical hypertrophy of the interventricular septum and posterior wall of the left ventricle. The ejection fraction was preserved - 62. A very interesting discovery (but I will not give an explanation for it today) was a layer of adipose tissue in the epicardium, which we are now also very actively studying at the department. And the volume of the left atrium was also slightly higher - 59 milliliters.
Diastolic function was present in all patients included in the study. I want to say that according to the European algorithm for diagnosing patients with diastolic function, we carried out both a traditional study of transmitral flow and tissue Doppler sonography, and our very good device now allows us to do this. We performed an ultrasound examination of the extracranial parts of the carotid arteries, measured the thickness of the intima-media complex according to the protocol, and we see that in the patients included in the study, the average thickness was 1.8. The norm is up to 0.9, respectively, they have already changed this ratio. And the presence of atherosclerotic plaque in patients in 28% of cases.
Academician Ivashkin V.T.: – Here we are observing the common carotid artery, measuring the internal carotid artery and the external carotid artery.
Professor Drapkina O.M.: – Yes. We measure here, where it is specifically shown with a yellow arrow, below, the thickness of the intima-media complex.
I present this slide only to show that both in terms of glucose and cholesterol levels, in principle, the patients in the lisinopril group were somewhat heavier in terms of blood pressure and body mass index, somewhat more obese, let’s say, in the lisinopril group. A study was conducted on insulin resistance, and we talked about insulin resistance when the HOMA index was more than 2.5. We also see that there is no difference in this indicator between the two compared groups.
We monitored blood pressure in all patients and identified certain features of the clinical course of arterial hypertension in metabolic syndrome in these patients. Firstly, they were distinguished by the fact that systolic-diastolic arterial hypertension was pronounced during the daytime, and it was systolic blood pressure that increased to a greater extent. In addition, obese hypertensive patients were distinguished by the fact that hypertensive load indices increased during the day, and especially at night. They did not experience a proper decrease in the level of night pressure, that is, they, roughly speaking, constituted a group of non-dippers.
And thus, very briefly, dear colleagues, let me present the data. These are initial data, not everything has been calculated yet. Here are the dynamics of systolic blood pressure against the background of lisinopril and its combinations with hydrochlorothiazide and amlodipine. We see that all patients in all groups achieved the target blood pressure value, and naturally, this delta was most noted in the group of patients who took Equator, let me remind you that this is lisinopril along with amlodipine. This is natural, since these two powerful antihypertensive drugs provide the most significant antihypertensive effect. The same was true for the level of diastolic blood pressure; I would like to note that a statistically significant difference was noted only in the combination therapy group, the last four columns, lisinopril together with amlodipine. After 12 weeks, a degree of reduction in blood pressure was noted in the group of patients who took lisinopril and lisinopril with hydrochlorothiazide, and we also see that there is a statistically significant difference in the level of systolic pressure, and there is no statistically significant difference in the level of diastolic pressure against the background of increased lisinopril hydrochlorothiazide.
Regarding this head-to-head comparison, we found that lisinopril had a slightly greater antihypertensive effect compared to perindopril in both systolic and diastolic blood pressure levels.
And now a few slides about what we received, and using these indicators we indirectly judged the possibility of influencing myocardial fibrosis; regression of left ventricular hypertrophy was noted in both the lisinopril group and the perindopril group. A decrease in left atrium volume was also noted in two groups of patients who were on lisinopril and perindopril, but, as we see in the green bars, it was slightly greater in the perindopril group. And we also saw an improvement in diastolic function. This is where the improvement in diastolic function occurred to a greater extent in patients who were on Diroton, apparently, this was associated with the better antihypertensive effect that we demonstrated in this study, shown in the previous slides.
No change in the thickness of the intima-media complex before treatment and after treatment after three months occurred in any group, and we see that from 1.08 this ratio changed to only 1.078.
Finally, the degree of reduction in insulin resistance was noted. We see here the first column is glucose, the second is insulin, and the third is the HOMA test, this is delta. Delta - minus 10 for glucose, minus 7 for insulin levels and minus 2.2 HOMA test was presented by patients who were on this therapy.
Thus, we can say that this study has shown the initial manifestations of hypertension management. And we can draw certain conclusions, the first conclusions, that the use of drugs based on lisinopril in patients with a combination of arterial hypertension and non-alcoholic fatty liver disease clearly led to an improvement and decrease in the level of systolic and diastolic pressure, left ventricular hypertrophy, atrial size, and improved diastolic relaxation and, let’s say, the indicators of lipid insulin metabolism did not change, but even improved. I want to say that the patients were on statins too. Of course, this is not the merit of either lisinopril or perindopril.
And I want to finish my speech by saying that we will deal with atrial disease, we will deal with atriomegaly. Life forces us to deal with this problem, because there are more and more hypertensive patients, and, accordingly, we will also analyze the issues of fibrosis, and we want them to be sufficiently understandable, because our predecessors also dealt with this. In his clinical lectures, Sergei Petrovich Botkin already gave a definition of this atrial disease. He said that the weakness of the atrium alone is enough for blood to stagnate in it, as well as in the veins flowing into it, which thus expand, their valves become insufficient and conditions are created for the appearance of this undulation. This meant undulation of the jugular veins, which we observe in various forms of weakened heart activity and insufficiently rapid emptying of the atria. So there is atrial disease and atriomegaly.
Left ventricular aneurysm on ECG*
Another important nuance, without which it is impossible to reveal the topic of scar changes, is “post-infarction aneurysm of the left ventricle.”
Its main symptom is the presence of ST segment elevation in leads where there are cicatricial changes (pathological Q waves). Unlike elevation during a heart attack (infarction with ST elevation), such elevation is not accompanied by reciprocal ST depression and does not disappear after the resolution of myocardial infarction, that is, it exists constantly.
It must be said that it is impossible to distinguish an aneurysm from an akinesia zone (an area of the heart that does not contract) on an ECG . But in an era when cardiac ultrasound had not yet appeared or was unavailable, the changes described above were associated exclusively with an aneurysm. We will not change anything so as not to cause confusion, we accept this definition, but with the above-mentioned amendment , and we will use the term “aneurysm” in further interpretation of the ECG.
Below is a typical ECG showing a “left ventricular aneurysm at the apex.”
The real basis of myths about myocardial changes: focal and diffuse
ECG reports drawn up by functional diagnostic specialists will certainly contain “focal” or “diffuse” changes. But, strangely enough, these terms and concepts cannot be found in international and national recommendations. And in the manuals written by the masters, there is a passing conversation about focal changes in M. S. Kushakovsky and about “changes” (in context - diffuse) in M. I. Kechker. It's a rather strange situation, isn't it?
In the conclusion I wrote “focal changes in the myocardium of a cicatricial nature,” after which the head of the department asked me not to use this phrase, because, having read about focality, clinicians immediately assume a heart attack. Indeed, the most dangerous manifestation of acute focal changes is the formation of pathological Q or QS, while the severity of the pathological process is judged by changes (elevation or depression) of the ST segment. Pathological Q and QS are observed as a manifestation of cicatricial post-infarction changes, as well as with certain turns and rotations of the heart.
In all cases where it is possible to determine the electrophysiological nature of the pattern and/or topic of the process, we can talk about focal changes in the myocardium. It turns out that this definition includes extrasystole and parasystole, escaped ectopic contractions, replacement rhythms and paroxysmal tachycardias, conduction disorders in the His-Purkinje system. However, an indication of a specific electrophysiological mechanism of rhythm disturbance and/or conduction is quite sufficient in conclusion and without mentioning the focal nature of the process.
With regard to changes in the ST segment, i.e. its elevation or depression, the diagnostic search is more complex and deeper. Such changes may be caused by the state of coronary blood flow, the inflammatory process in the myocardium and pericardium, or the manifestation of benign or malignant early ventricular repolarization syndrome.
“There are many diseases, but there is only one T wave” - this catchphrase from doctors of functional diagnostics reflects the depth and complexity of diagnosing changes in the T wave of the electrocardiogram - oxygen starvation of the myocardium, electrolyte imbalance, inadequacy of hormonal and humoral regulatory factors.
The specificity of changes in the ST segment and T wave is very low, but these changes need to be analyzed, interpreted and then described in the final report. There will always be terra incognita in medicine, and the conclusion “diffuse changes in the myocardium” has its right to exist. And there is no doubt that such a conclusion from a functional diagnostics doctor will necessarily require a fellow clinician to continue the diagnostic search.
I note that among diffuse changes there are mild, moderate and pronounced. The severity of the changes is determined by the number of ECG leads in which changes in the T wave are recorded: one to two, three to four or five to six leads. Diffuse changes consist in the registration of several patterns - a decrease in the amplitude of the T wave down to isoelectric T, inversion of the T wave into negative T, biphasic (plus-minus or minus-plus) morphology of the T wave.