Electrocardiography is an instrumental diagnostic method that allows one to study the electrical fields arising during heart contractions. The advantage of the method is its relative cheapness and the value of the data obtained during the procedure. With its help, it is possible to determine the heart rate, disturbances in the functioning of the myocardium and cardiac conduction, and assess the physical condition of the heart muscle.
During an ECG, a concept such as electrocardiographic leads (potential difference in electrocardiography) is used. When diagnosing heart disease, ECG leads are used in the arms, legs and sternum.
Indications for electrocardiography
The use of ECG is indicated in the following cases:
- during routine examinations, preventive examinations;
- to assess the condition of the heart muscle in patients before upcoming surgery;
- during examination of patients with diseases such as diabetes, pathologies of the lungs, thyroid gland, diseases of the endocrine system;
- for diagnosing arterial hypertension;
- during diagnosis of cardiac ischemia, atrial fibrillation, to determine which organ wall is affected;
- to identify heart defects in newborns and adult patients;
- when detecting disturbances in heart rhythm and conduction of cardiac impulses;
- to monitor the condition of the heart muscle during medical treatment.
Important! The norm or deviation of the obtained data is determined exclusively by a specialist with the necessary knowledge in this field.
Electric potential in ECG
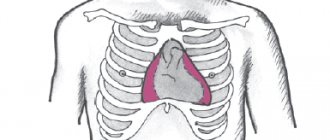
Many patients are interested in why, when examining the heart muscle, the electrodes of the device are placed not only on the chest, but also in the limbs? To understand this, you should find out some features of the functioning of the organ. During contractions, the heart synthesizes certain electrical signals, creating a kind of electric field that spreads throughout the body, including the right and left limbs. These waves diverge throughout the body in concentric circles. When measuring the potential in any area, the electrocardiograph will show equal potential values. The same electrical potential at any point is called equipotential in medical practice. The above measurements are carried out in the area of the hands and feet.
During electrocardiography, special sensors are used that are fixed on the patient’s chest and limbs
Another such circle is the human chest. Electrocardiography data is often recorded from the surface of the heart muscle (during open surgery in the heart), from other parts of the organ’s conduction system, for example, from the His bundle and others. That is, recording the ECG line curve is performed by recording the electrical signals of the chest and limbs. In this case, doctors receive a cardiogram recorded in all leads, since the electrical potentials of the heart muscle are, as it were, diverted from certain parts of the body.
Electrocardiogram. Part 1 of 3: Theoretical Basics of ECG
I’m starting the long-promised ECG cycle, which consists of 3 parts:
- theoretical foundations of ECG,
- ECG interpretation plan,
- some common pathological conditions on the ECG.
Required basic knowledge:
- cardiac conduction system (required),
- how the heart works (preferably).
The cycle was prepared based on the textbook “Electrocardiography” by V. V. Murashko and A. V. Strutynsky
, which is used in teaching medical students from the third year onwards.
This is an entry level guide. Practical work with ECG requires more in-depth knowledge, for example, the level of V. N. Orlov’s “Guide to Electrocardiography”
.
If you are not involved in medicine, but really want to understand a little about ECG, I recommend buying and mastering the book by Murashko and Strutynsky. The most important information is highlighted there separately, and questions and tasks for self-testing have answers
, which allows you to study on your own.
Electrocardiography
is a whole science that studies electrocardiograms (ECG), about which thick works and monographs are written. However, you can learn to distinguish a normal ECG from a pathological one. Mastery comes only with experience, when the number of deciphered ECGs reaches hundreds and thousands. At first, looking at each ECG will take up to 10-15 minutes, but experienced doctors and functional diagnostic specialists need no more than half a minute. The physical foundations of the ECG are studied in the first year of physics, and they begin to really decipher the ECG only in the third year of propaedeutics of internal diseases.
To understand the topic, you must know the conduction system of the heart, otherwise it will be extremely difficult to understand what processes are reflected on the ECG.
What exactly does the ECG machine record?
An electrocardiograph records the total electrical activity of the heart
, or more precisely, the difference in electrical potential (voltage) between 2 points.
Where does the potential difference arise
?
It's simple. At rest, myocardial cells are charged negatively from the inside and positively charged from the outside, while a straight line (= isoline) is recorded on the ECG tape. When an electrical impulse (excitation) arises and propagates in the conduction system of the heart, cell membranes move from a resting state to an excited state, changing polarity to the opposite (the process is called depolarization
).
In this case, the membrane becomes positive from the inside, and negative from the outside due to the opening of a number of ion channels and the mutual movement of K+ and Na+ ions (potassium and sodium) from and into the cell. After depolarization, after a certain time, the cells enter a resting state, restoring their original polarity (inside minus, outside plus), this process is called repolarization
.
The electrical impulse sequentially spreads throughout the parts of the heart, causing depolarization of myocardial cells. During depolarization, part of the cell becomes positively charged from the inside, and part is negatively charged. A potential difference arises
.
When the entire cell is depolarized or repolarized, there is no potential difference. The stage of depolarization corresponds to contraction of
the cell (myocardium), and the stage
of repolarization corresponds to relaxation
.
The ECG records the total potential difference from all myocardial cells, or, as it is called, the electromotive force of the heart
(cardiac emf). EMF of the heart is a tricky but important thing, so let’s return to it a little lower.
Schematic location of the cardiac EMF vector
(center) at one point in time.
ECG leads
As stated above, the electrocardiograph records the voltage (electrical potential difference) between 2 points
, that is, in some
lead
. In other words, the ECG device records on paper (screen) the magnitude of the projection of the electromotive force of the heart (cardiac emf) onto any lead.
Standard ECG is recorded in 12 leads
:
- 3 standard
(I, II, III), - 3 reinforced
from limbs (aVR, aVL, aVF), - and 6 chest
(V1, V2, V3, V4, V5, V6).
1) Standard leads
(suggested by Einthoven in 1913). I - between the left hand and the right hand, II - between the left foot and the right hand, III - between the left foot and the left hand.
simplest
(single-channel, i.e. recording no more than 1 lead at any time) the cardiograph has 5 electrodes:
red
(applied to the right hand),
yellow
(left hand),
green
(left leg),
black
(right leg) and chest ( sucker). If you start with the right hand and move in a circle, you can say that it is a traffic light. The black electrode represents “ground” and is needed only for safety purposes for grounding, so that a person does not get an electric shock in the event of a possible breakdown of the electrocardiograph.
Multichannel portable electrocardiograph
. All electrodes and suction cups differ in color and location.
2) Reinforced limb leads
(proposed by Goldberger in 1942). The same electrodes are used as for recording standard leads, but each of the electrodes in turn connects 2 limbs at once, and a combined Goldberger electrode is obtained. In practice, recording of these leads is done by simply switching the handle on a single-channel cardiograph (i.e., there is no need to rearrange the electrodes).
aVR
- enhanced abduction from the right hand (short for augmented voltage right - enhanced potential on the right).
aVL
- enhanced abduction from the left arm (left - left)
aVF
- enhanced abduction from the left leg (foot - leg)
3) Chest leads
(proposed by Wilson in 1934) are recorded between the chest electrode and the combined electrode from all 3 limbs. The chest electrode placement points are located sequentially along the anterolateral surface of the chest from the midline of the body to the left arm.
I don’t indicate too much detail, because it is not necessary for non-specialists. The principle itself is important (see figure). V1 - in the IV intercostal space along the right edge of the sternum. V2 V3 V4 - at the level of the apex of the heart. V5 V6 - along the left mid-axillary line at the level of the apex of the heart.
Location of 6 chest electrodes when recording an ECG
.
The 12 leads indicated are standard
.
additional
are “written” :
- according to Neb
(between points on the surface of the chest), - V7 - V9
(continuation of chest leads to the left half of the back), - V3R - V6R
(mirror reflection of chest leads V3 - V6 on the right [right] half of the chest).
Lead meaning
For reference: quantities can be scalar and vector. Scalar quantities only have magnitude
(numerical value), for example: mass, temperature, volume.
Vector quantities, or vectors, have both magnitude and direction
; for example: speed, force, electric field strength, etc. Vectors are indicated by an arrow above the Latin letter.
Why were so many leads
?
The EMF of the heart is the vector of the EMF of the heart in the three-dimensional world
(length, width, height) taking into account time. On a flat ECG film we can see only 2-dimensional values, so the cardiograph records the projection of the EMF of the heart on one of the planes in time.
Body planes used in anatomy
.
Each lead records its own projection of the cardiac EMF. First 6 leads
(3 standard and 3 enhanced from the limbs) reflect the EMF of the heart in the so-called
frontal plane
(see figure) and allow you to calculate the electrical axis of the heart with an accuracy of 30° (180° / 6 leads = 30°). The missing 6 leads to form a circle (360°) are obtained by continuing the existing lead axes through the center to the second half of the circle.
The relative position of standard and enhanced leads in the frontal plane
. But there is an error in the figure: aVL and lead III are NOT on the same line. Below are the correct drawings.
6 chest leads
reflect the EMF of the heart
in the horizontal (transverse) plane
(it divides the human body into upper and lower halves). This makes it possible to clarify the localization of the pathological focus (for example, myocardial infarction): interventricular septum, apex of the heart, lateral parts of the left ventricle, etc.
When analyzing an ECG, projections of the EMF vector of the heart are used, therefore such an ECG analysis is called vector
.
Note
. The material below may seem very complex. This is fine. When you study the second part of the series, you will return to it, and it will become much clearer.
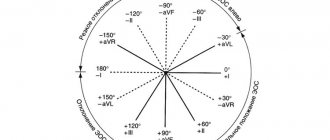
Electrical axis of the heart (EOS)
If you draw a circle
and draw lines through its center corresponding to the directions of three standard and three enhanced limb leads, then we obtain a
6-axis coordinate system
. When recording an ECG in these 6 leads, 6 projections of the total EMF of the heart are recorded, from which the location of the pathological focus and the electrical axis of the heart can be assessed.
Formation of a 6-axis coordinate system
. Missing leads are replaced by a continuation of existing ones.
Electrical axis of the heart
- this is a projection of the total electrical vector of the ECG QRS complex (it reflects the excitation of the ventricles of the heart) onto the frontal plane.
Quantitatively, the electrical axis of the heart is expressed by the angle?
between the axis itself and the positive (right) half of the axis of standard lead I, located horizontally.
It is clearly seen that the same EMF of the heart
in projections onto different leads gives different shapes of curves.
Determination rules
The positions of the EOS in the frontal plane are as follows: the electrical axis of the heart
coincides
with the one of the first 6 leads in which
the highest positive teeth
, and
is perpendicular
to the lead in which the size of the positive teeth
is equal to
the size of the negative teeth. Two examples of determining the electrical axis of the heart are given at the end of the article.
Variants of the position of the electrical axis of the heart:
- normal
: 30° > ? - vertical
: 70° > ? - horizontal
: 0° > ? - sharp axis deviation to the right
: 91° > ? - sharp axis deviation to the left
: 0° > ?
Options for the location of the electrical axis of the heart
in the frontal plane.
Normal electrical axis of the heart
approximately corresponds to its
anatomical axis
(in thin people it is directed more vertically from the average values, and in obese people it is directed more horizontally).
For example, with hypertrophy
(growth) of the right ventricle, the heart axis deviates to the right.
In case of conduction disturbances,
the electrical axis of the heart may deviate sharply to the left or right, which in itself is a diagnostic sign. For example, with a complete block of the anterior branch of the left bundle branch, a sharp deviation of the electrical axis of the heart to the left (? ? 30°) is observed, and the posterior branch to the right (? ? +120°).
Complete block of the anterior branch of the left bundle branch
.
The EOS is sharply deviated to the left
(? ?? 30°), because the highest positive waves are visible in aVL, and the equality of the waves is noted in lead II, which is perpendicular to aVL.
Complete block of the posterior branch of the left bundle branch
.
The EOS is sharply deviated to the right
(? ? +120°), because The tallest positive waves are seen in lead III, and the equality of the waves is noted in lead aVR, which is perpendicular to III.
Read further:
- Electrocardiogram. Part 2 of 3: ECG interpretation plan
- ECG part 3a. Atrial fibrillation and supraventricular paroxysmal tachycardia
Types of leads
The most commonly used is 12-lead ECG. These include:
- three standard leads;
- three reinforced;
- six leads from the chest.
A 12-lead ECG has diagnostic value and is used during electrocardiography to assess the condition of the heart and identify its various diseases.
Standard type leads
Each of the specific points of the electric field has its own potential. Electrocardiography allows you to record the potential difference at several measured points.
Standard leads are recorded as follows:
- Lead 1 – in this case, the positive electrode is fixed on the left hand, the negative electrode on the right hand;
- Lead 2 – sensor with a plus value on the left leg, negative electrode on the right hand;
- Lead 3 – a positive electrode is attached to the left leg, a negative electrode is attached to the left arm.
The indicators of the first, second and third leads are responsible for the work of one or another part of the heart muscle.
During an ECG, standard leads are considered the main type
Enhanced leads
The data is recorded by obtaining the difference between the electrical potential of one of the limbs, to the area of which the positive electrode is attached, and the average potentials of the other limbs.
Such leads in the diagram are designated by a combination of the letters aVF, aVL and aVR.
The connection of the electrical center of the heart muscle with the area of electrode attachment determines the axis of reinforced unipolar leads. This axis is divided into two equal parts. One of them is positive, directed towards the active electrode. The second is negative, directed towards the Goldberg electrode with a negative charge.
Thoracic leads
Electrocardiography leads in the chest area are designated by the letter V, proposed by Wilson. During electrocardiography, 6 chest leads are used. To do this, the electrode is placed on one or another point of the chest. ECG chest leads are schematically designated by a combination of Latin letters and numbers.
Electrode attachment area:
- area of the fourth intercostal section to the right of the chest – V1;
- area of the fourth intercostal section to the left of the chest - V2;
- the area between V2 and V4 – V3;
- midline of the clavicle and fifth intercostal space – V4;
- anterior axillary line and area of the fifth intercostal space – V5;
- the middle part of the axillary region and the space of the sixth intercostal space - V6.
Chest leads are located in the patient's sternum area
The use of a 12-lead ECG is the most common option. Electrocardiographic disturbances in each of them determine the overall electromotive force of the heart, that is, they are a consequence of the simultaneous influence on the discharge of the changing electrical potential in the walls of the heart, parts of the ventricles, the upper part of the organ and at its base.
Additional leads
To obtain more accurate information about the state of the heart muscle during electrocardiography, additional Neb leads are used. To carry out this type of diagnosis, sensors are used that are usually used for standard leads.
Neb lead data helps to identify pathological conditions associated with myocardial disorders in the posterior part of the organ, the anterior wall and the upper parts of the heart.
Important! Often additional leads are necessary to make a diagnosis for a particular disease.
What is an ECG, features of its registration, pros and cons of portable devices
We have all heard the abbreviation ECG more than once. Many of us even know how it stands for. Since childhood, we have all been familiar with the not very pleasant feeling of cold and wet electrodes on our chest. And the first thing we are told to do when questions about the heart arise is an electrocardiogram. But questions arise about how accurate this study is, how informative, what it can track, what affects the final result, how to interpret, how often to do it, what are the pros and cons of an ECG.
Optical heart rate sensors are no longer surprising. You can even buy a bracelet for the price of several cups of coffee that will be able to measure your pulse. But recently, more and more devices with ECG measurement function have appeared on the market. What is this, a marketing ploy or a really useful tool?
I will try to answer all these questions today. But let's take things in order.
What is an ECG? Electrocardiography is an accessible and informative technique for studying the functional state of the heart by graphically recording electrical impulses arising during cardiac activity. Electrocardiography is a relatively inexpensive but valuable method of electrophysiological instrumental diagnostics in cardiology. The direct result of electrocardiography is an electrocardiogram (ECG). It is the occurrence of electrical impulses in the heart that causes the rhythmic alternation of contraction (systole) and relaxation (diastole) of the heart muscle over a certain time range.
An electrocardiograph is a special medical device that records impulses coming from sensors mounted on the body and converts them into a graph, i.e. an electrocardiogram, which is subject to further analysis by a cardiologist. Since ECGs are performed in hospitals and at home, there are stationary and portable cardiographs.
In short, the electrocardiograph records the total electrical activity of the heart, or more precisely, the difference in electrical potentials (voltage) between 2 points
The main components of the device are:
- electrodes placed on a person’s arms, legs and torso;
- switch-regulator;
- signal amplifier;
- filter against network interference.
Modern cardiographs have high sensitivity to the bioelectrical activity of the heart muscle and accuracy in transmitting impulse oscillations.
Purpose and objectives of the ECG An electrocardiogram is taken for the correct diagnosis of heart disease. Using this procedure, the following parameters are assessed:
- Determination of frequency (see also pulse) and regularity of heart contractions (for example, extrasystoles (extraordinary contractions), or loss of individual contractions - arrhythmias).
- Indicates acute or chronic myocardial damage (myocardial infarction, myocardial ischemia).
- Can be used to identify metabolic disorders of potassium, calcium, magnesium and other electrolytes.
- Detection of intracardiac conduction disorders (various blockades).
- Screening method for coronary heart disease, including stress tests.
- Gives an idea of the physical condition of the heart (left ventricular hypertrophy).
- May provide information about non-cardiac diseases such as pulmonary embolism.
- Allows you to remotely diagnose acute cardiac pathology (myocardial infarction, myocardial ischemia) using a cardiophone.
- Must be used when undergoing medical examination.
Reasons to undergo an ECG examination is done in the following main cases:
- chronically high blood pressure;
- making a diagnosis for chest pain;
- obesity;
- jumping heart rate;
- monitoring in athletes
Among other things, an ECG can be prescribed in many other cases. An ECG is mandatory before operations, as it is one of the main tests on the basis of which permission to perform surgery is given.
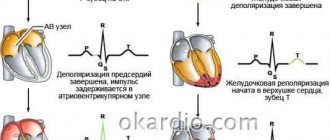
Type of electrocardiogram Graphic recording of an ECG is a broken line, the sharp corners (teeth) of which are located above and below the horizontal line on which time cycles are recorded. The teeth show the depth and frequency of rhythmic changes. An electrocardiogram reflects only electrical processes in the myocardium: depolarization (excitation) and repolarization (restoration) of myocardial cells.
Graphically, the ECG is a sequence of the QPRST complex. Each tooth of which is designated by a corresponding letter, and the intervals between the letters are nothing more than a display of the phases of the heart.
Correlation of ECG intervals with the phases of the cardiac cycle (ventricular systole and diastole)
- *Systole is one of the states of the heart muscle during heartbeat, namely the contraction of the left and right ventricles and the ejection of blood into the aorta from the left ventricle and into the pulmonary trunk from the right ventricle. Diastole (from the Greek diastole - expansion) - expansion of the cavities of the heart (associated with relaxation of the muscles of the atria and ventricles), during which it fills with blood; together with systole (contraction) constitutes the cycle of cardiac activity.
Waves and intervals on the ECG.
- P (atrial contraction),
- Q, R, S (all 3 teeth characterize ventricular contraction),
- T (ventricular relaxation),
- U (non-permanent wave, rarely recorded).
A segment on an ECG is a straight line segment between two adjacent waves. The PQ and ST segments are of greatest importance. For example, the PQ segment is formed due to a delay in the conduction of excitation in the atrioventricular (AV) node.
The interval consists of a tooth (a complex of teeth) and a segment. Thus, interval = tooth + segment. The most important are the PQ and QT intervals.
Waves, segments and intervals on the ECG.
There is no point in going into the topic of waves, intervals and segments, as well as into the analysis of the ECG itself. Cardiologists study for years to correctly interpret this complex complex. But you now have a general understanding of what an ECG is and what it looks like. Let's move on to how the electrical impulses themselves are recorded from the human body.
Taking an ECG and leads Where does the potential difference arise in the heart? It's simple. At rest, myocardial cells are charged negatively from the inside and positively from the outside, while a straight line (isoline) is recorded on the ECG tape. When an electrical impulse (excitation) arises and propagates in the conduction system of the heart, cell membranes move from a resting state to an excited state, changing polarity to the opposite (the process is called depolarization). In this case, the membrane becomes positive from the inside, and negative from the outside due to the opening of a number of ion channels and the mutual movement of K+ and Na+ ions (potassium and sodium) from and into the cell. After depolarization, after a certain time, the cells enter a resting state, restoring their original polarity (minus from the inside, plus from the outside), this process is called repolarization.
The electrical impulse sequentially spreads throughout the parts of the heart, causing depolarization of myocardial cells. During depolarization, part of the cell becomes positively charged from the inside, and part is negatively charged. A potential difference arises. When the entire cell is depolarized or repolarized, there is no potential difference. The stage of depolarization corresponds to contraction of the cell (myocardium), and the stage of repolarization corresponds to relaxation. The ECG records the total potential difference from all myocardial cells, or, as it is called, the electromotive force of the heart (cardiac emf).
Schematic location of the cardiac EMF vector (in the center)
Now there will be a very important point regarding the leads and understanding of the accuracy of the signal.
A standard ECG is recorded in 12 leads:
- 3 standard (I, II, III),
- 3 reinforced from limbs (aVR, aVL, aVF),
- and 6 chest (V1, V2, V3, V4, V5, V6).
Standard leads (proposed by Einthoven in 1913). I - between the left hand and the right hand, II - between the left foot and the right hand, III - between the left foot and the left hand.
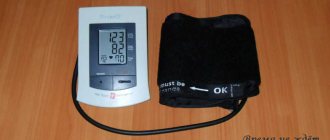
The simplest (single-channel, i.e. recording no more than 1 lead at any time, as in the photo above) cardiograph has 5 electrodes: red (applied to the right hand), yellow (left hand), green (left leg), black ( right leg) and pectoral (suction cup). If you start with the right hand and move in a circle, you can say that it is a traffic light. The black electrode represents “ground” and is needed only for safety purposes for grounding, so that a person does not get an electric shock in the event of a possible breakdown of the electrocardiograph.
Reinforced limb leads (proposed by Goldberger in 1942). The same electrodes are used as for recording standard leads, but each of the electrodes in turn connects 2 limbs at once, and a combined Goldberger electrode is obtained. In practice, recording of these leads is done by simply switching the handle on a single-channel cardiograph (i.e., there is no need to rearrange the electrodes).
aVR - enhanced abduction from the right hand (short for augmented voltage right - enhanced potential on the right). aVL - enhanced abduction from the left arm (left - left) aVF - enhanced abduction from the left leg (foot - leg)
Chest leads (proposed by Wilson in 1934) are recorded between the chest electrode and the combined electrode from all 3 limbs. The chest electrode placement points are located sequentially along the anterolateral surface of the chest from the midline of the body to the left arm.
Location of 6 chest electrodes when recording an ECG
The 12 leads indicated are standard. If necessary, additional leads are “written”:
- according to Neb (between points on the surface of the chest),
- V7 - V9 (continuation of chest leads to the left half of the back),
- V3R - V6R (mirror reflection of chest leads V3 - V6 on the right [right] half of the chest)
Lead values
For reference: quantities can be scalar and vector. Scalar quantities have only magnitude (numerical value), for example: mass, temperature, volume. Vector quantities, or vectors, have both magnitude and direction; for example: speed, force, electric field strength, etc. Vectors are indicated by an arrow above the Latin letter.
Why were so many leads invented? The EMF of the heart is the vector of the EMF of the heart in the three-dimensional world (length, width, height) taking into account time. On a flat ECG film we can see only 2-dimensional values, so the cardiograph records the projection of the EMF of the heart on one of the planes in time.
Body planes used in anatomy.
Each lead records its own projection of the cardiac EMF. The first 6 leads (3 standard and 3 reinforced from the limbs) reflect the EMF of the heart in the so-called frontal plane (see figure) and allow you to calculate the electrical axis of the heart with an accuracy of 30° (180° / 6 leads = 30°). The missing 6 leads to form a circle (360°) are obtained by continuing the existing lead axes through the center to the second half of the circle.
6 chest leads reflect the EMF of the heart in the horizontal (transverse) plane (it divides the human body into upper and lower halves). This makes it possible to clarify the localization of the pathological focus (for example, myocardial infarction): interventricular septum, apex of the heart, lateral parts of the left ventricle, etc.
When analyzing an ECG, projections of the EMF vector of the heart are used, therefore this ECG analysis is called vector. If we draw a circle and draw lines through its center corresponding to the directions of the three standard and three enhanced limb leads, we obtain a 6-axis coordinate system. When recording an ECG in these 6 leads, 6 projections of the total EMF of the heart are recorded, from which the location of the pathological focus and the electrical axis of the heart can be assessed.
Formation of a 6-axis coordinate system.
The electrical axis of the heart is the projection of the total electrical vector of the ECG QRS complex (it reflects the excitation of the ventricles of the heart) onto the frontal plane. Quantitatively, the electrical axis of the heart is expressed by the angle between the axis itself and the positive (right) half of the axis of standard lead I, located horizontally.
A correct understanding of the normal and pathological vectors of depolarization and repolarization of myocardial cells allows us to obtain a large amount of important clinical information. The right ventricle has a small mass, leaving only minor changes on the ECG, which leads to difficulties in diagnosing its pathology, compared to the left ventricle.
That is, in simple terms, the more leads we can register, the more complete the clinical picture will be. By registering only one lead, we deprive ourselves of important information. But more on this below.
Regarding accuracy Electrocardiographs are measuring instruments. And all measuring instruments must undergo verification, that is, some kind of research, on the basis of which it can be concluded that a particular device is truly accurate in the results that it produces. I don’t know how it is abroad, but in Russia ECGs are verified by a device of the Diatest-4 type, which is a signal generator that meets the requirements as a means of verification of myographs, rheographs, electrocardiographs, encephalographs, ensuring the setting of signal parameters with the required accuracy.
What else affects the reliability of the resulting ECG, besides the accuracy class of the device itself?
- interference in the electrical network;
- excitement of the subject;
- poor-quality contact of the sensor (a special gel is used to improve the passage of the electrical signal through the electrode);
- human factor (negligent attitude of medical personnel, who may incorrectly apply electrodes).
There are still a lot of nuances that can affect the result obtained as a result of ECG registration.
In addition, it should be separately noted that an ECG is not a panacea. An ECG is not capable of detecting absolutely all types of pathologies and abnormalities in the heart. Moreover, ECG is a real-time display of the heart, and many abnormalities are intermittent and intermittent. That is, having some kind of deviation in the functioning of the heart is far from a fact that it will manifest itself at the time of recording the ECG. And in this case, the ECG will be absolutely useless, even if you use the most extensive analysis using 12 leads.
And now it’s time to talk about portable devices for recording ECGs.
Appla Watch and analogues The presentation of the latest Apple Watch model caused a lot of noise. Mainly due to the fact that the gentlemen introduced a new watch feature that allows you to take an ECG directly from the owner’s hand. Almost every week another device with a similar function appears on the market, and journalists from specialized and not so specialized publications call such gizmos a breakthrough in engineering and a new word in the field of self-diagnosis. But let's figure out how it works and what we get as a result.
This watch has a special electrode on the back of the case. To take an ECG, it is necessary to “close” the circuit between the two hands and the heart, i.e. press the button on the side of the watch with your second hand, which will launch the ECG analysis function. What can be determined based on one lead, measuring the potential between the right and left arms? Only heart rate, which can be very useful for screening for atrial fibrillation. After measuring the ECG in this way, the only answer you will receive is that you have normal sinus rhythm or atrial fibrillation. Atrial fibrillation (atrial fibrillation, obsolete) is the most common cardiac arrhythmia. Atrial fibrillation is associated with various cardiovascular diseases that contribute to the development and maintenance of arrhythmia. There are several forms of AF, but the bottom line is that this type of rhythm disorder can be intermittent and not monitored by periodic ECG measurements using just 1 lead. The presence of AF in itself does not necessarily indicate a critical situation. Many people with AF have no symptoms at all, but others may periodically experience a fast or irregular heart rate. AFib becomes dangerous when it causes abnormalities in a person's vital signs, such that a person's blood pressure drops so much that they may lose consciousness, experience shortness of breath, or have a dangerously high pulse. If your heart rate exceeds 100-110 beats per minute, you are experiencing AF with tachysystole. At this point, the emergency room doctors could monitor your pulse with intravenous medications. And while short periods of asymptomatic AF may not be dangerous, persistent AF increases the risk of heart attack, blood clots in the lungs, and cardiac arrest. Depending on the patient's risk factors, some may require blood thinning. The longer your heart remains in uncontrolled AF, the more difficult it is to reverse cardiac changes.
What Apple Watch and analogues cannot do
- Currently, Apple Watch with ECG functionality is not designed to detect heart problems other than AFib.
- They are also not suitable for people who have already been diagnosed with AF - they need to see a doctor regularly.
- They cannot accurately detect the risk of a heart attack. Even a full 12-lead ECG may miss certain signs of a heart attack.
- They are not considered a US Food and Drug Administration (FDA) approved device. The FDA simply issues approvals, “pre-market 510k approval forms,” that explicitly state that the device is not intended for use by people under 22 years of age. The device is considered a Class II home use device, a class that includes condoms and pregnancy tests.
- They are not a device for continuously monitoring the electrical activity of the heart. They can only track the ECG when you touch the wheel with your other hand.
- It is physically impossible to construct an ECG with one electrode. To measure electrical activity, it is necessary to organize a closed circuit passing through the heart. Even a wireless device worn on the other hand will not cope with this, since it will not be part of the same circuit.
All of the above applies to absolutely all portable devices (watches, bracelets, phone cases, etc.) whose operating principle is based on recording potential changes only between two electrodes.
Overall, the new Apple Watch (and its analogues) look like a great tool, but they are not medical-grade devices, and are not a substitute for a professional medical assessment if symptoms arise. And even if the ECG on your Apple Watch looks normal, it doesn't mean you don't have AFib or other cardiac abnormalities.
A couple of thoughts to consider. Devices of this kind are not measuring instruments, they are not verified, and accordingly there is no control over the accuracy of the data obtained with this method of ECG registration. In addition, no special gels are used to improve the conductivity of electrical impulses through the skin, which has a fairly high resistance.
So the decision to purchase this type of device or not is up to you.
What to do? In addition to a regular ECG, I recommend performing an ECG under stress, i.e. on a treadmill, elliptical, bicycle ergometer. The picture under load will be even more complete. But this type of analysis is also not a panacea. A more informative type of research for pathologies that are periodic in nature is the use of a 24-hour monitor or Holter. There is also such a thing as echocardiography - an ultrasound method aimed at studying the morphological and functional changes of the heart and its valve apparatus. It is based on capturing ultrasound signals reflected from the structures of the heart. This method allows you to establish the condition of soft tissues, determine the thickness of the walls of the heart, the condition of the valve apparatus, the volume of the heart cavities, the contractile activity of the myocardium, see the work of the heart in real time, and trace the speed and characteristics of blood movement in the atria and ventricles of the heart.
Once again, I want to emphasize that when doing an ECG, you need to understand that various pathologies may not be detected. Even myocardial infarction sometimes cannot be tracked on an ECG or EchoCG. In this case, you need to do a blood test for markers of cardiomyocyte damage. But this is only in extreme cases. Currently, the most convincing marker is troponin. Troponin is a protein that is a component of thin muscle filaments and part of the troponin complex located in striated muscle.
How often should an ECG be done? I would recommend at least once a year to monitor the health of your heart muscle. If you are actively involved in sports, especially cyclic sports, then it is best to do this kind of analysis before the start of a new training season and possibly at its peak in the summer. Well, try to treat your heart as carefully as possible and track your heart rate and heart rate variability, which is very useful and informative during the preparation period.
How does an electrocardiograph work?
An electrocardiograph is a device designed to detect various pathologies and diseases of the heart muscle. The diagnostic method is based on obtaining the difference in electrical potentials. During normal heart function, this difference is weak or absent.
Most standard devices are equipped with 12 lead cables and 10 electrodes. During the procedure, 6 electrodes are attached to the patient’s chest, the remaining 4 are attached to the lower and upper extremities. Electrical impulses pass through the electrodes into the leads. In this case, the device records the data, recording it in the form of a graph. The resulting cardiogram is used to make a diagnosis.
An electrocardiograph is a device that allows you to record the electrical impulses of the heart on paper in the form of a graph.
Data decoding is carried out by a doctor, with their help the following indicators are determined:
- heart rate;
- cardiac conduction defects;
- which wall of the heart is affected;
- regularity of contractions;
- metabolic disturbances in the electrolyte balance of the organ;
- normal or pathological state of the myocardium;
- physical assessment of the condition of the heart muscle.
Electrocardiography allows you to identify both serious pathologies and heart defects, as well as minor disorders that do not require serious treatment.
More often, a standard scheme is used for diagnosis, but several types of electrocardiography can be used in medical practice:
- intraesophageal - in this case, the patient is inserted into the esophagus with an active electrode. This type of study is used for the differential diagnosis of supraventricular disorders with ventricular ones;
- Holter electrocardiography – the procedure is repeated over a long period of time, recording and comparing the data obtained;
- bicycle ergometry – carrying out the procedure during physical activity on the body (using an exercise bike);
- high-resolution electrocardiography and other methods.
Each type of laboratory test is prescribed by a doctor in accordance with the characteristics of the disease and the patient’s indications.
Do you need preparation for an ECG?
No specific preparation is required for an ECG, but in order to obtain the most correct results of the study, several aspects should be taken into account. The day before the diagnosis, experts recommend:
- sleep well;
- try to eliminate excessive emotional experiences;
- intra-nutritive electrocardiography is performed exclusively on an empty stomach;
- a few hours before the test, it is recommended to reduce fluid and food intake;
- During the diagnosis, you need to take off your clothes, relax, and not be nervous.
The day before the procedure, you should stop smoking and drinking alcohol.
During the ECG procedure, the patient is advised to relax and breathe evenly.
You should not engage in sports or heavy physical work. If you need to take certain medications, this must be discussed with your doctor. In addition, it is not recommended to visit a sauna, steam bath, or perform other procedures associated with the effects of heat on the body.
Important! No special preparation is required before performing an electrocardiogram, but following the above tips will help you obtain the most accurate data from any type of ECG.
How is an ECG interpreted?
Cardiogram analysis is deciphered exclusively by a specialist. Indicators include P, Q, R, S, T waves and ST and PQ segments. In turn, teeth directed upward are called positive, and teeth directed downwards are called negative.
Key ECG indicators:
- the source of excitation under normal conditions is accompanied by sinus rhythm;
- rhythm frequency – the gap between the R waves is no more than 10%;
- normal heart rate is 60-80 beats/min;
- rotation of the electrical axis of the heart muscle - from semi-horizontal to semi-vertical;
- The R wave is accompanied by a positive character;
- T wave – must be positive;
- PQ section – from 0.02 to 0.09 sec;
- section ST – runs along the isoline; normally there may be deviations of no more than 0.5 mm.
Electrocardiography is a method often used in medical practice that allows one to obtain detailed information about the condition of the heart and some other organs in a short period of time. The data obtained during diagnosis is used to identify many diseases, help to start treatment in a timely manner, and prevent serious complications.
Standard electrocardiogram
Description of the study
1. Standard ECG is a recording of electrical potentials in 12 leads:
1) leads from the limbs - electrodes are placed just above the hand, on the inner surface of the right (red) and left (yellow) forearms, and also slightly above the outer ankle on the left (green) and right (black - grounding) shin;
a) two-pole (standard) - I, II, III;
b) single-pole (reinforced) - aVL, aVR, aVF;
2) unipolar chest leads - V1–V6; location of electrodes on the chest →Fig. 25.1-1; leads Vr3 and Vr4 should be recorded routinely if inferior wall infarction is diagnosed (a likely criterion for concomitant right ventricular infarction is ST segment elevation at the J point in leads Vr3 and Vr4 ≥0.5 mm).
Figure 25.1-1.
Placement of ECG electrodes
2. Scheme of normal ECG recording →Fig. 25.1-2:
1) deviations up or down from the isoelectric line - waves P, Q, R, S, T, U; Q+R+S waves = QRS complex (without R = QS complex);
2) the horizontal line between the U and P waves or between the T and P waves, if the U waves are not detected, is an isoelectric line (isoline);
3) fragments of the line between the P wave and the QRS complex, as well as between the QRS complex and the T wave - these are the PQ and ST segments;
4) fragments of the curve, consisting of a segment and an adjacent tooth, are called PQ and QT intervals.
3. The ECG is recorded on a millimeter grid, which allows measurements of heart rate, duration and amplitude of individual morphological elements of the recording.
1) with a standard speed of movement of the electrographic tape of 25 mm/s, the time interval between thin vertical grid lines (small cell) is 0.04 s, and between thick lines (large cell) - 0.2 s (Fig. 25.1-3); at a movement speed of 50 mm/s - 0.02 s and 0.1 s;
2) The standard deviation of the isoelectric line (reference millivolt) is 1 cm = 1 mV, if the value of the reference millivolt is greater or less than 1 cm, then the wave amplitude measurements must be corrected according to the formula: corrected wave amplitude (in mm) = wave amplitude ( in mm) × 10 mm / amplitude of reference millivolt (in mm).
Figure 25.1-3.
Using a millimeter grid to determine the duration time (at a standard recording speed of 25 mm/s) and amplitude of individual morphological elements of the electrocardiogram
Heart rate assessment
1. Check the ECG recording speed.
2. Determine your heart rate using a special ruler; in the absence of a ruler:
1) if the rhythm is regular → it is necessary to calculate the duration of the interval between two adjacent R waves (RR interval) and divide 60 s by the result obtained, or count the number of large cells located in the RR interval - if the speed of the tape is 25 mm/s, then 1 cell = 300/min, 2 cells = 150/min, 3 cells = 100/min, 4 cells = 75/min, 5 cells = 60/min, 6 cells = 50/min;
2) if the rhythm is irregular → it is necessary to calculate how many QRS complexes are in a 6-second recording segment (at a tape speed of 25 mm/s this is 15 cm) and multiply by 10.
3. Assess the regularity of your heart rhythm.
4. Determine the origin of the rhythm:
1) is sinus rhythm the main one, if not, which one?
2) are QRS complexes of non-sinus origin observed, if so, what is their source of origin (ventricular or supraventricular) and are they premature?
5. Assess atrioventricular conduction - it is necessary to measure the PQ interval, check whether there are P waves (sinus? non-sinus?) without subsequent QRS complexes.
Morphological analysis of ECG
1. Electrical axis of the heart (EOS): usually determined approximately, based on a visual assessment of the direction of the QRS complexes in the limb leads →Fig. 25.1-4
1) in I and III, positive - normal position of the EOS (from +30° to +90°);
2) in I and III they are directed towards each other - deviation of the heart axis to the right (pravogram)
a) in lead aVF positive - from +90° to ±180°;
b) in lead aVF negative - ±180° to -90° (undefined EOS; according to the recommendations of the American Heart Association (AHA), the American Society of Cardiology (ACC) and the Association for Rhythm Disorders (HRS) - axis deviation up and to the right);
3) in I and III they are directed away from each other (diverging)
a) in II, positive – normal position of the EOS (from +30° to –30°);
b) in II negative - deviation of the heart axis to the left (levogram; from –30° to –90°).
2. P wave: represents atrial depolarization:
1) positive in I and II - indicate the correct direction of atrial depolarization, are an electrocardiographic sign of sinus rhythm;
2) negative in II and III - indicate the opposite direction of atrial depolarization (excitations and rhythms emanating from the lower part of the right or left atria, AV node or ventricles);
3) dilated ≥0.12 s, associated mainly with their notching or splitting - may be associated with an increase (hypertrophy, dilatation) of the left atrium or with intra-atrial conduction disorders. An additional, more characteristic sign of left atrium enlargement is biphasic, positive-negative P waves in V1 (negative phase ≥0.04 s and ≥1 mm); widened and split P waves in the limb leads, as well as pathological biphasic ones in lead V1 are called P mitral.
4) high (>2.5 mm in the limb leads, >3 mm in the chest leads) - increased activation of the sympathetic nervous system or enlargement of the right atrium (P pulmonale). Tall and widened P waves in the limb leads and biphasic with a deep and wide negative phase in lead V1 are observed in patients with hypertrophy of both atria due to congenital heart defects. Such teeth are called P cardiale.
5) invisible - hidden behind the T wave during accelerated sinus rhythm or layered on the QRS complexes (simultaneous depolarization of the atria and ventricles can occur with rhythms emanating from the ventricles or AV node). The actual absence of P waves occurs in the case of slow pacemaker activity of the sinus node or in the case of sinoatrial block. The absence of P waves despite normal sinus node function may be due to a delay in atrial electrical activity (the condition for diagnosing this rare pathology on the ECG is the simultaneous detection of absence of atrial mechanical activity or A waves on the atrial electrocardiogram and lack of response to atrial stimulation).
6) biphasic atrial waves (F waves) in the chest and standard leads with a frequency of usually 250–350/min → atrial flutter → fig. 2.6-10;
7) polymorphic, low-amplitude atrial waves (f waves) with a frequency of 350–600/min, which are better visualized in leads V1–V2 - atrial fibrillation →Fig. 2.6-10.
3. PQ segment: corresponds to the period of atrial repolarization:
1) oblique depression - hypertrophy of the right atrium, hypersympathicotonia;
2) horizontal depression - acute pericarditis;
3) elevation (rarely) - may be a symptom of a right or left atrium infarction.
4. PQ interval: total duration of the P wave and PQ segment; displays AV conduction time, that is, the time it takes for an impulse to pass through the right atrium and the AV node, normally 0.12–0.20 s.
1) lengthening (persistent or intermittent) - AV block → section. 2.7.2;
2) shortening - conduction of impulses through an additional AV conduction pathway (pre-excitation syndrome → section 2.6.3), most often, accelerated conduction through the AV node under the influence of hypersympathicotonia.
5. QRS complex: reflects the depolarization of the ventricular myocardium. It is necessary to evaluate the direction of the dominant deviation (determining the position of the electrical axis of the heart →see above), duration (on average 0.06–0.11 s), amplitude of the R, S and Q waves:
1) expansion ≥0.12 s (and deformation) - pathological depolarization of the ventricles:
a) blockade of the right or left bundle branch → section. 2.7.2;
b) premature depolarization of the ventricles due to an additional AV conduction pathway in preexcitation syndrome → section. 2.6.3;
c) impulses and rhythms of ventricular origin - absence of P waves before the QRS complexes →Fig. 2.1-1, fig. 2.6-14;
d) nonspecific disturbances of intraventricular impulse conduction - expansion of all teeth of the QRS complex, in the absence of signs of blockade of the right or left bundle branch;
2) amplitude of the R and S waves - used to diagnose hypertrophy of the left and right ventricles → table. 25.1-1. Low QRS amplitude (<5 mm in all limb leads and <10 mm in all precordial leads) is the most common sign of constrictive pericarditis or pericardial effusion.
3) pathological Q waves: any Q waves ≥0.02 s or QS complexes in leads V2 and V3; Q waves ≥0.03 s and depth ≥1 mm or QS complexes in 2 adjacent leads (I, aVL, and possibly V6; V4–V6; II, III, aVF). An analogue of the Q waves are the QS complexes, which under normal conditions can be observed in lead aVR, less often in III and V1, sporadically in V1–V2. In other leads, their presence refers to pathological symptoms. In patients without subjective symptoms in whom new pathological Q waves are detected on a routine ECG, silent myocardial infarction is diagnosed. Appearance within 28 days indicates a recurrence of a heart attack, and over 28 days indicates a recurrent heart attack.
Causes of pathological Q waves and QS complexes:
a) change in the conditions of conduction through working cardiomyocytes - focal necrosis of the left ventricular myocardium (myocardial infarction), “stunned myocardium”, cardiomyopathy (mainly hypertrophic, with subaortic stenosis), pre-excitation syndrome;
b) change in the conditions of impulse conduction through the intraventricular pathway - blockade of the left leg (QS complexes in leads V1–V3), blockade of the anterior branch of the left leg (qrS complexes in lead V2);
c) displacement of the heart in the chest - dilatation of the right ventricle (QR complexes in V1, V1-V2 or V1-V3), pulmonary emphysema (QS complexes in V1-V3), left ventricular hypertrophy (QS complexes in V1-V3).
6. ST segment: displays the initial phase of repolarization of the ventricular myocardium; Normally, in the limb leads and left ventricular chest leads it is on the isoelectric line. In the right ventricular chest leads, oblique elevation is often observed, smoothly turning into the ascending knee of the T waves →Fig. 25.1-5A:
1) ST elevation (significant elevation measured at the J point - elevation in leads V2–V3 ≥1.5 mm in women and ≥2.5 mm in men under the age of 40 years and ≥2 mm in men after 40 years, and in other leads ≥1 mm in men and women)
a) elevation of the J point with “trough-shaped” ST elevation in the chest leads, less often in the chest leads and limb leads, in exceptional cases only in the limb leads - early ventricular repolarization syndrome (a variant of a normal ECG, Fig. 25.1-5B). According to the modern expanded definition, this syndrome includes cases with J-point elevation, regardless of the position of the ST segment. It is considered that J-point elevation is ≥1 mm in the form of a jagged (Fig. 25.1-5B) or rounded origin of the terminal phase of the R wave in at least 2 leads from limbs II, III and aVF and/or thoracic V4–V6, especially when coexistent horizontal or downsloping ST segment may be a sign of electrical instability of the ventricular myocardium, which in turn predisposes to life-threatening ventricular arrhythmia and sudden cardiac death.
b) elevation of the J point ≥2 mm in V1–V2 (in ≥1 of these leads) with oblique elevation of the ST segment and a smooth transition to a negative T wave - Brugada syndrome (after excluding other causes);
c) horizontal or convex upward (Purdy wave) with depression in the reciprocal leads - acute transmural ischemia (Fig. 25.1-5D) or acute myocardial infarction (Fig. 25.1-5D). Persistent elevation of the ST segment in leads with pathological Q waves or QS complexes is a manifestation of impaired myocardial contractility in the infarction zone.
d) horizontal, in most leads, with discordant depression only in leads aVR and V1 - suspicion of the acute phase of pericarditis (damage due to the inflammatory process in the subepicardial layers of the myocardium). This diagnosis is supported by concomitant depression of the PQ segment.
e) obliquely ascending - hypervagotonia, ventricular depolarization disorders (branch block, premature ventricular excitation syndrome, ventricular extrasystoles and rhythms);
2) ST depression (significant ST depression measured at the J point - depression in precordial leads V1–V3 ≥0.5 mm, and in other leads ≥1 mm in men and women)
a) obliquely ascending (Fig. 25.1-6A) - rarely is a manifestation of ischemia of the subendocardial layers of the left ventricle, more often observed with hypersympathicotonia; has no diagnostic value for detecting myocardial ischemia;
b) horizontal (Fig. 25.1-6B) - ischemia of the heart muscle, but can be observed in other diseases and even in absolutely healthy people;
c) obliquely descending (Fig. 25.1-6B) - may be associated with subendocardial ischemia, most often a consequence of a pathological path of ventricular depolarization (left ventricular hypertrophy, bundle branch block or premature ventricular excitation syndrome).
7. Wave T: reflects the final phase of repolarization of the ventricular myocardium. Normally, T waves are positive in leads I, II, and V2–V6, positive or negative in leads III, aVL, aVF, and V1, and negative in aVR. There is no upper limit on the duration and amplitude of normal T waves:
1) negative in V2–V3 - can be considered a variant of the norm if the amplitude in lead V3 is less than in V2, and in V2 is less than in V1. Deep, negative ones are often characteristic of myocardial infarction, less often - for myocarditis, hypertrophic cardiomyopathy, pheochromocytoma or stroke.
2) high - can be observed in healthy individuals as a consequence of increased activity of the parasympathetic nervous system, and also be a symptom of acute ischemia or hyperkalemia;
3) flat - an uncharacteristic sign associated with myocardial damage due to various heart diseases or extracardiac factors (electrolyte disturbances, hypothyroidism, drugs, increased activity of the sympathetic nervous system);
4) biphasic and negative - blockade of the legs, premature ventricular excitation syndrome, premature or additional ventricular impulses and rhythms; pathological negative T waves remaining after resolution of bundle branch block, pre-excitation syndrome or ventricular rhythm may be associated with the so-called “cardiac memory” phenomenon if the direction of their deviations corresponds to the direction of the QRS complexes, previously deformed due to pathological depolarization of the ventricles.
8. QT interval: the total time of depolarization and repolarization of the ventricular myocardium. May differ in individual leads (measurements in the lead with the longest QT interval; in the case of superimposition of the T wave on the U wave →Fig. 25.1-7), depends on heart rate, to a lesser extent on gender, age and activity of the autonomic nervous system. To correct the duration of the QT interval, depending on the heart rate, the Bazett formula is used:
Figure 25.1-7.
Measuring the duration of the QT interval
corrected QT (QTc) = measured QT (s)/√ RR interval (s)
If the QRS complex is wide (≥0.12 s), the JT interval, calculated from the end of the QRS complex to the end of the T wave, is a more reliable indicator than the QT interval of the duration of ventricular muscle repolarization. A prolongation of the JT interval (calculated by Bazett's formula Jtc > 0.36 s) in this situation is a more significant indicator of a poor prognosis than a prolongation of the QT interval.
1) short QT interval - hyperkalemia, hypercalcemia, hypothermia, hereditary short QT syndrome (QTc <0.34 s or <0.36 s and ≥1 sign: pathogenic genetic mutation, family history of short QT syndrome or cases of sudden premature (≤ 40 years) death, episode of ventricular tachycardia or ventricular fibrillation without concomitant organic heart disease);
2) prolonged QT interval (≥0.45 s - in men and ≥0.46 s - in women); long QT syndrome (QTc ≥0.48 s, but diagnosis is possible with QTc 0.46–0.47 s and fainting of unknown origin) - causes → section. 2.6.11.
9. U wave: the origin is unclear, may be invisible on a standard ECG; if visible, then its greatest amplitude is in leads V1–V3, which normally has the same direction as the preceding T wave; amplitude <2 mm in right ventricular leads and <1 mm in standard and chest left ventricular leads:
1) high - usually in combination with the T wave, found in patients with hypokalemia, pheochromocytoma, stroke or congenital long QT syndrome; high, but clearly demarcated from the T wave, refer to symptoms of hypervagotonia;
2) negative - rarely observed, the cause may be ischemia, acute myocardial infarction or left ventricular hypertrophy.
Differential diagnosis of a bifurcated T wave and layering of T and U waves: when layering, the distance between the apexes is >150 ms.
Impact of electrolyte disturbances
1. Hyperkalemia:
1) ≈5.5 mmol/l → increased amplitude and narrowing of T waves, shortening of the QT interval;
2) 5.5-7.5 mmol/l → widening of QRS complexes, flattening of P waves, prolongation of the PQ interval;
3) >7.5 mmol/l → asynchronous depolarization and repolarization of the ventricular myocardium → asystole or ventricular fibrillation.
2. Hypokalemia:
1) <3.5 mmol/l (in patients with renal failure immediately after hemodialysis, even with normal concentrations, but less than the initial value) - decreased amplitude of T waves, increased amplitude and widening of U waves, depression of the ST segment;
2) with more severe hypokalemia - prolongation of the PQ interval, expansion of the QRS complexes, ventricular extrasystole, polymorphic ventricular tachycardia torsade de pointes.
3. Hypercalcemia: shortening of QT intervals (associated with shortening or disappearance of the ST segment). The coexistence of short QT in combination with tall and widened U waves suggests the presence of electrolyte disturbances (hypercalcemia and hypokalemia), which are observed in patients with multiple myeloma.
4. Hypocalcemia: prolongation of QT intervals associated with ST segment prolongation. The shape of the T waves usually does not change, and there is rarely flattening or inversion of the T waves.
Influence of the autonomic nervous system
1. Hypersympathicotonia: acceleration of sinus rhythm, shortening of the PQ and QT intervals, increased amplitude of P waves, decreased amplitude, less commonly, inversion of T waves, downward depression of the ST segment.
2. Hypervagotonia: slowing of sinus rhythm, prolongation of the PQ interval, increased amplitude of T waves, oblique elevation of the ST segment, usually in the right ventricular precordial leads. Signs of hypervagotonia are a typical ECG change during sleep. During the waking period, they usually occur in young people, especially often in well-trained men.