What is EOS?
When deciphering an electrocardiogram, one of the parameters is the EOS - the electrical axis of the heart. This indicator indirectly reflects the position of this organ in the chest.
The atria and ventricles of the heart are controlled by impulses that travel through the conduction system. When taking a cardiogram, electrical signals passing inside the heart muscle are recorded.
For ease of measurement, the heart is schematically represented as a three-dimensional coordinate axis.
When added together, the pulses form a directed electric vector. It is projected onto the frontal vertical plane. This is EOS. Usually the electrical axis coincides with the anatomical one.
What should its normal position be?
The anatomical structure of the heart is such that its left ventricle weighs more than the right. Therefore, the electrical excitation on the left side of the organ is stronger.
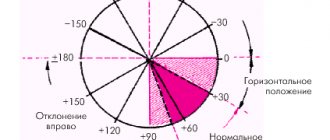
Graphically, this is expressed in the fact that the axis is directed diagonally to the left and down. If you look at the vector projection, the left side of the heart is located in the area from +30 to +70 degrees. This is the normal value for an adult.
The position of the axis also depends on the individual characteristics of physiology.
The direction of EOS is influenced by the following factors:
- Pulse speed.
- The ability of the heart muscle to contract.
- Features of the structure of the spine, chest, internal organs that interact with the heart.
Taking these factors into account, the normal axis value ranges from 0 to +90 degrees.
In a healthy person, the EOS can be in one of the following positions:
- Normal - the angle of deviation from the coordinate axis is from +30 to +70 degrees.
- Intermediate - from +15 to +60.
- Vertical - between +70 and +90. This is typical for thin people with a narrow chest.
- Horizontal - from 0 to + 30 degrees. It occurs in people with a wide chest and short stature.
In newborns, deviation of the EOS to the right is often observed. By one or two years, she moves to a vertical position. After children reach the age of three, the axis usually returns to its normal position.
This is due to the growth of the heart, in particular, with an increase in the mass of the left ventricle.
Standard electrocardiography in pediatric practice
Electrocardiography (ECG) remains one of the most common methods for examining the cardiovascular system and continues to develop and improve. Based on the standard electrocardiogram, various modifications of the ECG have been proposed and are widely used: Holter monitoring, high-resolution ECG, tests with dosed physical activity, drug tests [2, 5].
Leads in electrocardiography
The concept of “electrocardiogram lead” means recording an ECG when electrodes are applied to certain areas of the body that have different potentials. In practical work, in most cases, registration of 12 leads is limited: 6 from the limbs (3 standard and 3 “unipolar reinforced”) and 6 thoracic leads - unipolar. The classic lead method proposed by Einthoven is the registration of standard limb leads, designated by Roman numerals I, II, III [6].
Enhanced limb leads were proposed by Goldberg in 1942. They record the potential difference between one of the limbs on which the active positive electrode of a given lead is installed (right arm, left arm or left leg), and the average potential of the other two limbs. These leads are designated as follows: aVR, aVL, aVF. The designations for augmented limb leads come from the first letters of English words: a - augmented (reinforced), V - voltage (potential), R - right (right), L - left (left), F - foot (leg).
Unipolar chest leads are designated by the Latin letter V (potential, voltage) with the addition of the position number of the active positive electrode, indicated in Arabic numerals:
lead V1 is an active electrode located in the fourth intercostal space along the right edge of the sternum;
V2 - in the fourth intercostal space along the left edge of the sternum;
V3 - between V2 and V4;
V4 - in the fifth intercostal space along the left midclavicular line;
V5 - in the fifth intercostal space along the anterior axillary line;
V6 - in the fifth intercostal space in the midaxillary line.
Using the chest leads, you can judge the condition (size) of the heart chambers. If the usual program for recording 12 generally accepted leads does not allow one to reliably diagnose a particular electrocardiographic pathology or requires clarification of some quantitative parameters, additional leads are used. These could be leads
V7 - V9, right chest leads - V3R-V6R [6].
Electrocardiogram recording technique
The ECG is recorded in a special room, remote from possible sources of electrical interference. The study is carried out after a 15-minute rest on an empty stomach or no earlier than 2 hours after a meal. The patient should be undressed to the waist, the lower legs should be freed from clothing. Electrode paste must be used to ensure good skin contact with the electrodes. Poor contact or the appearance of muscle tremors in a cool room can distort the electrocardiogram. The examination, as a rule, is carried out in a horizontal position, although nowadays examinations have also begun to be carried out in a vertical position, since in this case a change in autonomic support leads to a change in some electrocardiographic parameters [7].
It is necessary to record at least 6-10 cardiac cycles, and in the presence of arrhythmia, much more - on a long tape.
Normal electrocardiogram
On a normal ECG, 6 waves are distinguished, designated by the letters of the Latin alphabet: P, Q, R, S, T, U. The electrocardiogram curve (Fig. 1) reflects the following processes: atrial systole (P wave), artioventricular conduction (PR interval or, as it was previously designated as the P-Q interval), ventricular systole (QRST complex) and diastole - the interval from the end of the T wave to the beginning of the P wave. All waves and intervals are characterized morphologically: the teeth - by height (amplitude), and the intervals - by time duration, expressed in milliseconds. All intervals are frequency-dependent quantities. The relationship between heart rate and the duration of one or another interval is given in the corresponding tables. All elements of a standard electrocardiogram have a clinical interpretation.
| Figure 1. Normal electrocardiogram |
Electrocardiogram analysis
The analysis of any ECG should begin with checking the correctness of its recording technique: to exclude the presence of various interferences that distort the ECG curve (muscle tremors, poor contact of electrodes with the skin), it is necessary to check the amplitude of the control millivolt (it should correspond to 10 mm). The distance between the vertical lines is 1 mm, which corresponds to 0.02 s when the belt moves at a speed of 50 mm/s, and 0.04 s at a speed of 25 mm/s. In pediatric practice, a speed of 50 mm/s is preferable, since against the background of physiological age-related tachycardia, errors are possible when calculating intervals at a tape speed of 25 mm/s.
In addition, it is advisable to take an ECG with a change in the patient’s position: in the wedge- and orthoposition, since in this case a change in the nature of autonomic support can contribute to a change in some parameters of the electrocardiogram - a change in the characteristics of the pacemaker, a change in the nature of the rhythm disturbance, a change in heart rate, a change in characteristics conductivity [2].
The general scheme of ECG analysis includes several components.
- Analysis of heart rate and conductivity: - determination of the source of excitation; - counting the number of heartbeats; — assessment of the regularity of heart contractions; — assessment of the conductivity function.
- Determination of rotations of the heart around the anteroposterior, longitudinal transverse axes: - the position of the electrical axis of the heart in the frontal plane (rotations around the anteroposterior, sagittal axis); — rotations of the heart around the longitudinal axis; - rotation of the heart around the transverse axis.
- Analysis of the atrial P wave.
- Analysis of the ventricular QRST complex: - analysis of the QRS complex; — analysis of the RS-T segment; - T wave analysis; - QT interval analysis.
- Electrocardiographic report.
Heart rate and conduction analysis
The source of excitation is determined by determining the polarity of the P wave and its position relative to the QRS complex. Sinus rhythm is characterized by the presence in standard lead II of positive P waves preceding each QRS complex. In the absence of these signs, a non-sinus rhythm is diagnosed: atrial, rhythm from the AV junction, ventricular rhythms (idioventricular), atrial fibrillation.
Counting the number of heartbeats is carried out using various methods. The most modern and simplest method is counting using a special ruler. If this is not available, you can use the following formula:
Heart rate = 60 RR,
where 60 is the number of seconds in a minute, RR is the duration of the interval, expressed in seconds.
If the rhythm is incorrect, you can limit yourself to determining the minimum and maximum heart rate, indicating this spread in the “Conclusion”.
Heart rate regularity is assessed by comparing the duration of RR intervals between successively recorded cardiac cycles. The RR interval is usually measured between the tips of the R (or S) waves. The spread of the obtained values should not exceed 10% of the average duration of the RR interval. It has been shown that sinus arrhythmia of varying severity is observed in 94% of children. Conventionally, V degrees of sinus arrhythmia severity are distinguished:
I degree - there is no sinus arrhythmia or fluctuations in heart rate per 1 minute do not exceed 5 contractions;
II degree - mild sinus arrhythmia, rhythm fluctuations within 6-10 contractions per minute;
III degree - moderately severe sinus arrhythmia, rhythm fluctuations within 11-20 contractions per 1 minute;
IV degree - pronounced sinus arrhythmia, rhythm fluctuations within 21-29 contractions per 1 minute;
V degree - pronounced sinus arrhythmia, rhythm fluctuations within 30 or more contractions per minute. Sinus arrhythmia is a phenomenon inherent in healthy children of all ages [7].
In addition to physiologically observed sinus arrhythmia, abnormal (irregular) heart rhythm can be observed with various types of arrhythmias: extrasystole, atrial fibrillation and others.
Assessment of conduction function requires measurement of the duration of the P wave, which characterizes the speed of conduction of the electrical impulse through the atria, the duration of the PQ (PR) interval (conduction speed through the atria, AV node and His system) and the total duration of the ventricular QRS complex (conduction of excitation through the ventricles). An increase in the duration of intervals and waves indicates a slowdown in conduction in the corresponding part of the conduction system of the heart.
The PQ interval (PR) corresponds to the time it takes for an impulse to travel from the sinus node to the ventricles and varies depending on age, gender and heart rate. It is measured from the beginning of the P wave to the beginning of the Q wave, and in the absence of a Q wave, to the beginning of the R wave. Normal fluctuations in the PR interval are between 0.11-0.18 s. In newborns, the PR interval is 0.08 s, in infants - 0.08-0.16 s, in older ones - 0.10-0.18 s. Slowing of atrioventricular conduction may be due to vagal influence [1, 2].
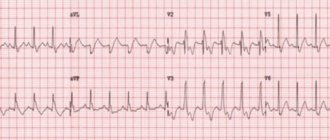
The PR interval may be shortened (less than 0.10 s) as a result of accelerated impulse conduction, innervation disorders, due to the presence of an additional fast conduction path between the atria and ventricles. Figure 3 shows one of the options for shortening the PR interval.
This electrocardiogram (see Fig. 2) reveals signs of the Wolff-Parkinson-White phenomenon, including: shortening of the PR interval to less than 0.10 s, the appearance of a delta wave on the ascending limb of the QRS complex, deviation of the electrical axis of the heart to the left. In addition, secondary ST-T changes may be observed. The clinical significance of the presented phenomenon lies in the possibility of the formation of supraventricular paroxysmal tachycardia by the re-entry mechanism (re-entry of the impulse), since additional conduction pathways have a shortened refractory period and are restored to conduct the impulse faster than the main pathway [8].
| Figure 2. ECG of child V. G., 14 years old. Diagnosis: Wolff-Parkinson-White phenomenon |
Determination of the position of the electrical axis of the heart
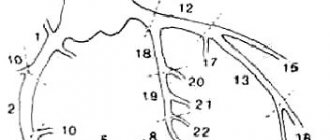
Rotations of the heart around the anteroposterior axis. It is customary to distinguish three conventional axes of the heart, as an organ located in three-dimensional space (in the chest).
The sagittal axis is anteroposterior, perpendicular to the frontal plane, passing from front to back through the center of mass of the heart. Turning counterclockwise along this axis brings the heart to a horizontal position (displacement of the electrical axis of the QRS complex to the left). Rotate clockwise to a vertical position (displacement of the QRS electrical axis to the right).
The longitudinal axis anatomically runs from the apex of the heart to the right venous opening. When rotated clockwise along this axis (viewed from the apex of the heart), most of the anterior surface of the heart is occupied by the right ventricle; when rotated counterclockwise, the left ventricle is occupied.
The transverse axis passes through the middle of the base of the ventricles perpendicular to the longitudinal axis. When rotating around this axis, a displacement of the heart is observed with the apex forward or the apex backward.
The main direction of the electromotive force of the heart is the electrical axis of the heart (EOS). Rotations of the heart around the conventional anteroposterior (sagittal) axis are accompanied by deviation of the EOS and a significant change in the configuration of the QRS complex in standard and enhanced unipolar limb leads.
Rotations of the heart around the transverse or longitudinal axes are referred to as so-called positional changes.
The determination of EOS is carried out using tables. To do this, compare the algebraic sum of the R and S waves in standard leads I and III.
There are the following options for the position of the electrical axis of the heart:
- normal position when the alpha angle is from +30° to +69°;
- vertical position - alpha angle from +70° to +90°;
- horizontal position - alpha angle from 0° to +29°;
- axis deviation to the right - alpha angle from +91° to +180°;
- axis deviation to the left - alpha angle from 0° to - 90°.
The nature of the location of the heart in the chest, and, accordingly, the main direction of its electrical axis, is largely determined by the characteristics of the physique. In children with asthenic physique, the heart is located vertically. In children with a hypersthenic constitution, as well as with a high position of the diaphragm (flatulence, ascites), it is horizontal, with a deviation of the apex to the left. More significant turns of the EOS around the anteroposterior axis, both to the right (more than +90°) and to the left (less than 0°), are usually caused by pathological changes in the heart muscle. A classic example of deviation of the electrical axis to the right is the situation with a ventricular septal defect or tetralogy of Fallot. An example of hemodynamic changes leading to deviation of the electrical axis of the heart to the left is aortic valve insufficiency.
An easier way to roughly determine the direction of the EOS is to find the limb lead in which the R wave is the highest (without an S wave or with a minimal S wave). If the maximum R wave in lead I is a horizontal position of the EOS, if in lead II it is normal, if in lead aVF it is vertical. Registration of the maximum R wave in lead aVL indicates a deviation of the EOS to the left, in lead III - a deviation of the EOS to the right, but if the maximum R wave is in lead aVR, the position of the EOS cannot be determined.
Atrial P wave analysis
P wave analysis includes: change in P wave amplitude; measurement of P wave duration; determination of P wave polarity; determination of the shape of the P wave.
The amplitude of the P wave is measured from the isoline to the top of the wave, and its duration is measured from the beginning to the end of the wave. Normally, the amplitude of the P wave does not exceed 2.5 mm, and its duration is 0.10 s.
Since the sinus node is located in the upper part of the right atrium between the mouths of the superior and inferior vena cava, the ascending part of the sinus node reflects the state of excitation of the right atrium, and the descending part reflects the state of excitation of the left atrium, and it is shown that the excitation of the right atrium occurs before the left by 0. 02-0.03 s. The normal P wave is rounded in shape, gently sloping, with symmetrical rise and fall (see Fig. 1). The cessation of atrial excitation (atrial repolarization) is not reflected on the electrocardiogram, as it merges with the QRS complex. In sinus rhythm, the direction of the P wave is positive.
In normosthenics, the P wave is positive in all leads except lead aVR, where all electrocardiogram waves are negative. The largest value of the P wave is in standard lead II. In individuals of asthenic physique, the size of the P wave increases in standard III and aVF leads, while in lead aVL the P wave may even become negative.
With a more horizontal position of the heart in the chest, for example in hypersthenics, the P wave increases in leads I and aVL and decreases in leads III and aVF, and in standard lead III the P wave may become negative.
Thus, in a healthy person, the P wave in leads I, II, aVF is always positive, in leads III, aVL it can be positive, biphasic or (rarely) negative, and in lead aVR it is always negative.
Ventricular QRST analysis
The QRST complex corresponds to the electrical systole of the ventricles and is calculated from the beginning of the Q wave to the end of the T wave.
Components of the electrical systole of the ventricles: the QRS complex itself, the ST segment, the T wave.
The width of the initial ventricular QRS complex characterizes the duration of excitation transmission through the ventricular myocardium. In children, the duration of the QRS complex ranges from 0.04 to 0.09 s, in infants - no wider than 0.07 s.
The Q wave is the negative wave before the first positive wave in the QRS complex. The Q wave can be positive only in one situation: congenital dextracardia, when it is facing upward in standard lead I. The Q wave is caused by the spread of excitation from the AV junction to the interventricular septum and papillary muscles. This most variable ECG wave may be absent in all standard leads. The Q wave must meet the following requirements: in leads I, aVL, V5, V6, not exceed 4 mm in depth, or 1/4 of its R, and also not exceed 0.03 s in duration. If the Q wave does not meet these requirements, it is necessary to exclude conditions caused by a deficiency of coronary blood flow [2]. In particular, in children, anomalous origin of the left coronary artery from the pulmonary artery (ALCA from PA or Bluntd-White-Garland syndrome) often appears as a congenital pathology of the coronary vessels [2,3]. With this pathology, the “coronary” Q wave is most often persistently detected in lead aVL (Fig. 3).
| Figure 3. ECG of child R. B., 4 years old. Diagnosis: anomalous origin of the left coronary artery from the pulmonary artery |
The presented electrocardiogram (see Fig. 3) reveals a deviation of the electrical axis of the heart to the left. In lead aVL, the Q wave is 9 mm, with a height of R = 15 mm, the duration of the Q wave is 0.04 s. At the same time, in standard lead I, the duration of the Q wave is also 0.04 s, in the same lead there are pronounced changes in the final part of the ventricular complex in the form of depression of the ST interval. The suspected diagnosis of anomalous origin of the left coronary artery from the pulmonary artery was confirmed by echocardiography and then by coronary angiography.
At the same time, in infants, a deep Q wave may be in lead III, aVF, and in lead aVR the entire ventricular complex may have a QS appearance.
The R wave consists of ascending and descending knees, is always directed upward (except in cases of congenital dextracardia), reflects the biopotentials of the free walls of the left and right ventricles and the apex of the heart. The ratio of the R and S waves and the change in the R wave in the chest leads are of great diagnostic importance. In healthy children, in some cases, different sizes of the R wave are observed in the same lead - electrical alternans.
The S wave, like the Q wave, is an unstable negative ECG wave. It reflects a somewhat late coverage of excitation of distant, basal areas of the myocardium, supraventricular crests, conus arteriosus, and subepicardial layers of the myocardium.
The T wave reflects the process of rapid repolarization of the ventricular myocardium, i.e., the process of restoration of the myocardium or cessation of excitation of the ventricular myocardium. The state of the T wave, along with the characteristics of the RS-T segment, is a marker of metabolic processes in the ventricular myocardium. In a healthy child, the T wave is positive in all leads except aVR and V1. In this case, in leads V5, V6, the T wave should be 1/3-1/4 of its R.
The RS-T segment—the segment from the end of the QRS (the end of the R or S wave) to the beginning of the T wave—corresponds to the period of full coverage of the ventricles by excitation. Normally, an upward or downward displacement of the RS-T segment is permissible in leads V1-V3 of no more than 2 mm [4]. In the leads most distant from the heart (in standard and unipolar leads from the limbs), the RS-T segment should be on the isoline, with a possible upward or downward displacement of no more than 0.5 mm. In the left chest leads, the RS-T segment is recorded on the isoline. The transition point of the QRS to the RS-T segment is designated as the RS-T junction point j (junction).
The T wave is followed by a horizontal T-P interval, corresponding to the period when the heart is at rest (diastole).
The U wave appears 0.01-0.04 s after the T wave, has the same polarity and ranges from 5 to 50% of the height of the T wave. To date, the clinical significance of the U wave has not been clearly defined.
QT interval. The duration of ventricular electrical systole has important clinical significance, since a pathological increase in ventricular electrical systole may be one of the markers of the appearance of life-threatening arrhythmias.
Electrocardiographic signs of hypertrophy and overload of the heart cavities
Cardiac hypertrophy is a compensatory adaptive reaction of the myocardium, expressed in an increase in the mass of the heart muscle [6]. Hypertrophy develops in response to increased stress in the presence of acquired or congenital heart defects or with increased pressure in the pulmonary or systemic circulation.
Electrocardiographic changes in this case are caused by: an increase in the electrical activity of the hypertrophied part of the heart; slowing down the conduction of an electrical impulse through it; ischemic, dystrophic and sclerotic changes in the altered heart muscle.
However, it should be noted that the term “hypertrophy” widely used in the literature does not always strictly reflect the morphological essence of the changes. Often, dilatation of the heart chambers has the same electrocardiographic signs as hypertrophy, with morphological verification of the changes.
When analyzing the ECG, the transition zone (Fig. 4) in the precordial leads should be taken into account.
| Figure 4. Condition of the main electrocardiogram waves in the chest leads. Transition zone |
The transition zone is determined by the lead in which the R and S waves, i.e., their amplitude on both sides of the isoelectric line, are equal (see Fig. 4). In healthy older children, the QRS transition zone is usually determined in leads V3, V4. When the ratio of vector forces changes, the transition zone moves towards their predominance. For example, with right ventricular hypertrophy, the transition zone moves to the position of the left precordial leads and vice versa.
Signs of atrial overload
Electrocardiographic signs of left atrium overload form an electrocardiographic complex of signs, called P-mitrale in the literature. Enlargement of the left atrium is a consequence of mitral regurgitation with congenital, acquired (due to rheumatic carditis or infective endocarditis), relative mitral regurgitation or mitral stenosis. Signs of left atrium overload are presented in Figure 5.
Enlargement of the left atrium (see Fig. 5) is characterized by:
- an increase in the total duration (width) of the P wave by more than 0.10 s;
- widened double-humped P wave in leads I, aVL, V5-V6;
- the presence of a pronounced negative phase of the P wave in lead V1 (more than 0.04 s in duration and more than 1 mm in depth).
| Figure 5. ECG of child K.I., 12 years old. Diagnosis: rheumatism, age-related rheumatic carditis, mitral valve insufficiency |
Since the lengthening of the P wave can be caused not only by an enlargement of the left atrium, but also by intra-atrial block, the presence of a pronounced negative phase of the P wave in lead V1 is more important when assessing overload (hypertrophy) of the left atrium. At the same time, the severity of the negative phase of the P wave in lead V1 depends on the heart rate and on the general characteristics of the wave voltage.
Electrocardiographic signs of overload (hypertrophy) of the right atrium form a complex of signs called P-pulmonale, since it develops in pulmonary pathology, as well as in chronic pulmonary heart disease. However, these conditions are uncommon in children. Therefore, the main causes of enlargement of the right atrium are congenital heart defects, such as Ebstein's tricuspid valve anomaly, as well as primary changes in the pulmonary artery - primary pulmonary hypertension.
| Figure 6. ECG of child V.S., 13 years old. Primary pulmonary hypertension |
Signs of right atrium enlargement are presented in Figure 6.
- Enlargement of the right atrium (see Fig. 6) is characterized by:
- a high-amplitude P wave with a pointed apex in leads II, III, aVF, this sign is required in lead V1 or V2;
- with a P wave duration not exceeding 0.10 s.
In Figure 6, in addition to signs of right atrium overload, there are also signs of right ventricular overload.
Signs of ventricular overload (hypertrophy)
Since the ECG normally reflects the activity of only the left ventricle, electrocardiographic signs of left ventricular overload emphasize (exaggerate) the norm. Where the R wave is normally high (in lead V4, the position of which coincides with the left border of the heart), it becomes even higher; where the S wave is normally deep (in lead V2), it becomes even deeper.
Many voltage criteria for overload (hypertrophy) of the left ventricle have been proposed - more than 30. The most well-known include the Sokolov-Lyon index: the sum of the amplitudes of the R wave in lead V5 or V6 (where there is more) and S in lead V1 or V2 (where there is more ) more than 35 mm. However, the amplitude of the waves in the precordial leads is influenced by the gender, age and constitution of the patient. Thus, an increase in the voltage of the teeth can be observed in thin young people. Therefore, secondary changes in the final part of the ventricular complex are of great importance: displacement of the ST interval and T wave. As a sign of a relative deficiency of coronary blood flow, deepening of the Q wave in leads V5, V6 is possible. But at the same time, the Q wave should not exceed more than 1/4 of its R and 4 mm in depth, since this sign indicates a primary coronary pathology [2].
Predominant dilatation of the left ventricle has the following characteristics: R in V6 is greater than R in V5, greater than R in V4 and greater than 25 mm; sudden transition from deep S waves to high R waves in the precordial leads; shift of the transition zone to the left (towards V4) (Fig. 7).
| Figure 7. ECG of child G. Sh., 3 years old. Diagnosis: congenital mitral valve insufficiency |
Signs of predominant hypertrophy of the left ventricular myocardium are depression (displacement below the isoline) of the ST segment in lead V6, possibly also in V5 (Fig.  [4, 7].
| Figure 8. ECG of child G. Sh., 3 years old. Diagnosis: congenital mitral valve insufficiency |
Electrocardiographic signs of overload (hypertrophy) of the right ventricle appear when its mass increases by 2-3 times. The most reliable sign of right ventricular hypertrophy is the qR complex in lead V1.
Additional signs are secondary changes in the form of ST segment displacement and changes in the T wave. In some pathological conditions, in particular with an atrial septal defect, right ventricular hypertrophy is also demonstrated by incomplete right bundle branch block in the form of rsR in lead V1 (Fig. 9) [ 7].
| Figure 9. ECG of child M.K., 8 years old. Diagnosis: atrial septal defect |
In conclusion, a standard electrocardiogram is very important for an adequate diagnosis, subject to several rules. This is, firstly, taking an electrocardiogram with a change in body position, which makes it possible to initially differentiate organic and inorganic damage to the heart. Secondly, this is the choice of the optimal shooting speed - for children 50 mm/s. Finally, the electrocardiogram should be analyzed taking into account the individual characteristics of the child, including his constitution.
For questions regarding literature, please contact the editor.
The editors apologize for typos
In the output of the article “Foot and Mouth Disease”, No. 8 2004, you should read:
A. E. Kudryavtsev, Candidate of Medical Sciences, Associate Professor, T. E. Lisukova, Candidate of Medical Sciences, Associate Professor, G. K. Alikeeva, Candidate of Medical Sciences Central Research Institute of Epidemiology, Ministry of Health of the Russian Federation, Moscow
In the article by I. Yu. Fofanova “Some issues of the pathogenesis of intrauterine infections”, No. 10.2004. On page 33 in the 2nd column from left to right it should be read: “In the second trimester (after clarification of the diagnosis), the use of antibacterial therapy is indicated, taking into account the sensitivity of antibiotics (penicillin or macrolides). Prescription of amoxiclav, augmentin, ranklav, azitrox, sumamed during pregnancy is possible only when the expected benefit to the mother outweighs the potential risk to the fetus or child. Despite the fact that experimental studies have not revealed the teratogenic effects of these drugs, their use during pregnancy should be avoided.”
E. V. Murashko, Candidate of Medical Sciences, Associate Professor of Russian State Medical University, Moscow
What could cause it to shift to the right?
A sharp deviation of the electrical vector from its axis is sometimes caused by processes occurring inside the body (pregnancy, development of tumors, etc.).
However, most often this means the presence of disturbances in the functioning of the heart muscle.
An axis shift can occur for the following pathological reasons:
- Ischemic disease. Blockage of the arteries that provide blood supply to the myocardium develops.
- Impaired blood flow in the branches of the pulmonary artery. Occurs as a result of vasoconstriction, which causes pressure in the right side of the heart to increase.
- Myocardial infarction. Against the background of ischemic disease, tissue necrosis develops due to insufficient blood supply.
- The opening between the left atrium and the ventricle narrows (stenosis), which leads to significant tension in the right side of the organ and its subsequent hypertrophy.
- Blockage of the pulmonary artery (thrombosis).
- Arrhythmia is a heartbeat disorder accompanied by chaotic excitation of the atria.
- The occurrence of chronic pulmonary pathology in which hypertrophy of the right atrium and ventricle is observed. In medicine, this disease is called “cor pulmonale.”
- Abnormal development of the myocardium, in which there is a displacement of the organ to the right side. At the same time, the electrical axis also deviates.
A shift of the axis to the right is also observed due to long-term use of tricyclic antidepressants, resulting in severe intoxication of the body. This negatively affects the functioning of the heart.
When the EOS is deviated to the right side in newborns, this is considered normal.
However, if the shift is associated with a blockade of the bundle branches (impaired passage of electrical impulses through the bundles of heart cells), then an additional examination of the baby is performed.
Cardiac pathologies can be congenital or acquired during life, which develop as a result of previous serious illnesses or due to increased physical activity.
For example, professional athletes are often diagnosed with an increase in the mass and volume of the left ventricle (hypertrophy).
Pathological deviations of the axis: what do they mean and what are the consequences?
The situation itself cannot serve as a basis for making a specific diagnosis, only indicating the presence of electrical disturbances. No cardiologist will convince you of the presence of pathology only based on EOS. To establish the fact of the disease, it is necessary to support the examination conclusion with the correct clinical interview and additional diagnostic measures.
The position of the EOS is influenced by a number of factors:
- congenital heart defects;
- secondary changes in the anatomical relationships between the right and left parts of the heart;
- abnormal location of organs in the chest cavity (dextrocardia, vicarious emphysema after lobectomy);
- chest deformation (kyphosis, scoliosis, carinatum or funnel-shaped curvature);
- disruptions in the conduction system of the organ (especially in the Hiss bundles), which cause heartbeat disturbances;
- cardiomyopathies of various origins;
- long history of hypertension and coronary heart disease (CHD);
- chronic heart failure;
- respiratory diseases with an obstructive component (COPD, bronchial asthma, emphysema);
- decompensated liver failure (ascites, flatulence).
What diseases cause disturbances?
Deviation of the electrical axis of the heart to the left (levogram) (angle α from 0 to -300) has several reasons:
- Hypertrophy of the left half of the heart. Angle α is directly proportional to the degree of growth of LV mass. The pathology develops with idiopathic cardiomyopathy, arterial hypertension, excessive stress (“athletic heart”), coronary artery disease, and cardiosclerosis.
- Myocardial infarction (with necrosis along the posterior wall).
- Pathology of intracardiac conduction. Most often this is a blockade of the left leg or the anterior superior branch of the Hiss bundle.
- Ventricular tachycardia.
- Valvular heart defects.
- Myocarditis.
There is also a sharp deviation of the EOS to the left when the angle α > -300.
Deviation of the electrical axis of the heart to the right (rightogram) (angle α > +900) is observed when:
- Failures in the conduction of nerve impulses along the fibers of the Hiss bundle.
- Pulmonary stenosis (when pressure in the right ventricle increases).
- IBS.
- Myocardial infarction of the right sections.
- Cardiorespiratory diseases that have formed a “pulmonary heart” (in this case, the LV does not function fully and overload of the right ventricle occurs).
- Thromboembolism of the branches of the pulmonary artery (due to blockage, gas exchange in the lungs is disrupted, the vessels of the pulmonary circulation narrow and overload of the pancreas occurs).
- Mitral valve stenosis (after rheumatic fever). The fusion of the leaflets prevents the complete expulsion of blood from the left atrium, which causes pulmonary hypertension and overloads the RV.
A sharp deviation of the EOS to the right is observed at the angle α = +1200.
It is worth remembering that none of the above diseases can be diagnosed based solely on the position of the EOS. This parameter is only an auxiliary criterion in identifying any pathological process.
Signs of displacement on the ECG
The angle of the electrical axis and its direction are the main characteristics when deciphering the ECG.
The interpretation of the cardiogram is given by a cardiologist. To do this, he uses special diagrams and tables designed to determine the displacement of the EOS.
The diagnostician examines the QRS waves on the electrocardiogram. This is a set of symbols that shows the sinus rhythm of the heart and displays the polarization of the ventricles.
QRS waves characterize their contraction or relaxation. R – tooth directed upward (positive), Q, S – negative, or directed downward. Q is before R and S is after it. Based on these signs, the cardiologist judges how the axis is shifting.
Deviation of the electrical axis of the heart to the right occurs if R is greater in the third lead than in the first. If the highest R amplitude is in the second lead, the EOS corresponds to the normal position.
Diagnosis of cardiac conduction disorders (part 2)
intraventricular conduction Disorders of intraventricular conduction can be divided according to the level of damage into two groups - proximal and distal. The group of proximal disorders includes blockades resulting from conduction disturbances in the His bundle. The group of distal conduction disorders includes disorders that occur at the level of the left or right bundle branch and two branches of the left bundle (Fig. 14). 1. Right bundle branch block (RBBB). 2. Left bundle branch block (LBBB). 3. Block of the anterior branch of the left bundle branch (ALBBB). 4. Block of the posterior branch of the left bundle branch (LPBL). 5. Block of the right bundle branch in combination with blockade of the anterior branch of the left leg (double-bundle block: RBBB and RBBB). 6. Block of the right bundle branch in combination with a block of the posterior branch of the left bundle (two-bundle block: RBBB and BZVLBP). 7. Block of the left bundle branch in combination with blockade of the anterior branch of the left leg (double-bundle block: LBBB and LBBB). 8. Bilateral bundle branch block (LBBB and RBBB). 9. Three-bundle block (RBBB + BPVLNPG + BZVLNPG, RBBB + BPVLNPG + AV block I–II stages, RBBB + BPVLNPG + AV block I–II stages). 10. Arborization blockade. 3.4.1. Right bundle branch block (RBBB) is a conduction disorder along the right bundle branch, as a result of which excitation spreads in the usual way to the left ventricle and in a roundabout way, with a delay, to the right ventricle (Fig. 15). The ECG shows a widened, deformed QRS complex (more than 0.1 s), which in leads V1–V2, III, aVF has the form rsR', RSR', RsR', rR' (the R wave predominates in combination with the QRS). Depending on the width of the QRS complex, right bundle branch block can be complete or incomplete. 3.4.2. Left bundle branch block (LBBB) is a conduction disorder in the main trunk of the left bundle branch before it divides into two branches or simultaneous damage to two branches of the left bundle branch. Excitation spreads in the usual way to the right ventricle and in a roundabout way, with a delay, to the left ventricle (Fig. 16). The ECG shows a widened, deformed QRS complex (more than 0.1 s), which in leads V5–V6, I, aVL looks like rsR', RSR', RsR', rR' (the R wave predominates in the QRS complex). Depending on the width of the QRS complex, right bundle branch block can be complete or incomplete 3.4.3. Block of the anterior branch of the left bundle branch (LABLB, left anterior hemiblock, anterior left block, anterolateral block, left ventricular focal block, parietal block, atypical left bundle branch block, pronounced deviation of the EOS to the left, upper left intraventricular block, qRI–rSII–rSIII syndrome, syndrome S2–S3, abnormal left axis deviation, left anterior fascicular block) is a conduction disorder that occurs along the anterior branch of the left bundle branch (Fig. 17, 18). Blockade of the anterior branch of the left leg is identified by the deviation of the electrical axis of the heart: to the left (EOS from 0 to -30˚) - incomplete LPVP, or sharply to the left (EOS more than -30˚) - complete BPLP. 3.4.4. Block of the posterior branch of the left bundle branch (LPBL, left posterior hemiblock, left posterior focal block, peri-infarction diaphragmatic block, pronounced deviation of the EOS to the right, block of the left lower branch, abnormal right axis deviation, left posterior fascicular block) is a conduction disorder that occurs on along the posterior branch (Fig. 19, 20). Blockade of the posterior branch of the left leg is detected by the deviation of the electrical axis of the heart: to the right (EOS from +90 to +120˚) - incomplete LVLP, or sharply to the right (EOS more than +120˚) - complete BLBP. 3.4.5. Block of the septal branch of the left bundle branch. The septal branch is formed by part of the fibers of both branches of the LBP and provides impulses to the interventricular septum. ECG signs: absence of Q wave in leads V5–V6. Differential diagnosis 1. Intraventricular blocks (bundle branches, three-bundle). 3.4.6. Block of the right bundle branch in combination with a block of the anterior branch of the left leg (block of the right leg with left anterior hemiblock, block of the right leg with a strong deviation of the EOS to the left, block of the right leg of the Bailey type) is a two-bundle block with simultaneous damage to the right leg and the anterior branch of the left bundle branches (Fig. 21, 22). The ECG shows signs of RBBB (QRS complex more than 0.1 s, with a predominant R wave in leads V1–V2, III, aVF) in combination with signs of RBBB (deviation of the EOS to the left or sharply to the left). 3.4.7. Right bundle branch block in combination with left posterior branch block (right bundle block with left posterior hemiblock, classic right bundle branch block, rare type of right bundle branch block) is a two-bundle block with simultaneous damage to the right bundle and the posterior branch of the left bundle branch. The ECG shows signs of RBBB (QRS complex more than 0.1 s, with a predominant R wave in leads V1–V2, III, aVF) in combination with signs of RBBB (deviation of the EOS to the right or sharply to the right) (Fig. 23, 24). 3.4.8. Block of the left bundle branch in combination with block of the anterior branch of the left leg is a two-bundle block with simultaneous damage to the main trunk of the left leg and its anterior branch. A similar ECG picture occurs when incomplete blockade of the posterior branch is combined with complete blockade of the anterior branch of the left leg (Fig. 25). The ECG shows signs of LBBB (QRS complex more than 0.1 s, with a predominant R wave in leads V5–V6, I, aVL) in combination with signs of LBBB (deviation of the EOS to the left or sharply to the left). 3.4.9. Block of the left bundle branch in combination with a block of the posterior branch of the left leg is a two-bundle block with simultaneous damage to the main trunk of the left leg and its posterior branch. A similar ECG picture occurs when incomplete blockade of the anterior branch is combined with complete blockade of the posterior branch of the left leg (Fig. 26). The ECG shows signs of LBBB (QRS complex more than 0.1 s, with a predominant R wave in leads V5–V6, I, aVL) in combination with signs of LBBB (deviation of the EOS to the right or sharply to the right).
* Part 1, see RMJ. 2013, no. 4. pp. 237–240.
Additional diagnostic methods
If the patient's ECG shows a tendency for the EOS to shift to the right, additional examination is carried out in order to make an accurate diagnosis.
Basically, this indicator indicates an increase in the mass of the right side of the heart.
The following diagnostic methods are used:
- Chest X-ray. The pictures show an enlargement of the heart muscle, if any.
- Ultrasound of the heart. The method allows you to obtain a complete visual picture of the state of the myocardium.
- Holter monitoring. Used in the presence of sinus arrhythmia or tachycardia in the patient.
- Electronic cardiogram with additional load (for example, on an exercise bike) - to determine coronary artery disease.
- Angiography - reveals disturbances in the functioning of the coronary vessels.
- MRI.
Should I be worried and what should I do?
In itself, displacement of the electrical axis of the heart is not a disease; it only indicates the possible presence of pathologies. Cardiologists believe that one of the main reasons for deviation of the cardiac axis to the right is hypertrophy of the heart muscle.
If a shift to the right side is detected, additional examinations must be immediately performed. Based on their results, the doctor will prescribe treatment if any disorder is detected.
Usually, a sharp deviation of EOS on the electrocardiogram does not signal a threat to life. Only a strong change in the vector angle (up to +900) can alert the doctor. With this indicator, cardiac arrest may occur. The patient is immediately transferred to the intensive care unit.
To avoid serious consequences, if there is a displacement of the EOS, it is recommended to be examined by a cardiologist every year.
Author of the article: Yulia Dmitrieva (Sych) - In 2014, she graduated with honors from Saratov State Medical University named after V. I. Razumovsky. Currently working as a cardiologist at the 8th City Clinical Hospital in the 1st clinic.