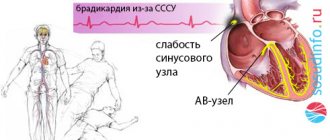
The feeling of rapid heartbeat, or tachycardia, accompanied by a very high heart rate (more than 100 per minute), can be caused by many diseases that lead to arrhythmia. Often such symptoms, together with specific changes in the electrocardiogram, are based on the anatomical features of the conduction system of the heart, which is responsible for the correct heart rhythm. The combination of such features constitutes clinical syndromes, generalized by the concept of shortening of the PQ interval.
So, shortened PQ interval syndrome is a group of electrocardiological symptoms, the basis of which is a decrease in the time it takes electrical excitation to reach the ventricles from the atria through the atrioventricular connection. This group includes Wolff-Parkinson-White syndromes (WPV syndrome)
, as well as
Clerc-Levy-Cristesco syndrome (CLC syndrome)
. These syndromes can occur at any age, even in the neonatal period, regardless of gender differences.
What happens with short PQ syndrome?
The PQ interval is a purely electrocardiographic criterion that allows one to evaluate the transmission time of an electrical impulse from the sinus node in the atrium to the contractile fibers located in the ventricles. In other words, it reflects the operation of the atrioventricular junction, a kind of “switch” that redirects electrical excitation from the atria to the ventricles. Normally, it is no less than 0.11 seconds and no more than 0.2 seconds:
example of shortening PQ to 0.03 s
- An increase in the interval beyond the specified time indicates a slowdown in conduction through the atrioventricular node,
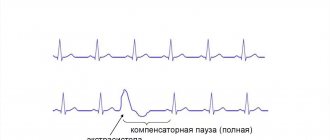
- Shortening means that the excitation is carried out too quickly. In fact, there is more frequent impulse of the ventricles, with the so-called “reset” of excitation.
The shortening of this interval is due to the presence of additional conduction bundles in the conduction system of the heart.
It is through them that additional pulses are reset. Therefore, at certain moments the ventricles receive double impulses - physiological in a normal rhythm (60-80 per minute), and pathological, through bundles.
There may be several pathological bundles, and all of them are named after the names of the authors who first discovered them. Thus, the Kent and Maheim bundles are characteristic of the SVC syndrome, and the James bundles are characteristic of the CLC syndrome. In the first case, the pathological discharge of impulses goes from the atria directly to the ventricles, in the second, the James bundle passes through the atrioventricular node, that is, the node is stimulated first, and then the ventricles. Due to the “throughput” capacity of the AV node, part of the impulses conducted to the ventricles returns through the same bundle to the atria, therefore such patients have a high risk of developing paroxysmal supraventricular tachycardia.
main types of pathological pathways of additional conduction through the heart
PQ Interval and PQ Segment
The PQ interval is determined from the beginning of the P wave to the beginning of the QRS complex. The PQ interval corresponds to the time it takes for an electrical impulse to travel through the atria and the atrioventricular node.
The duration of the PQ interval normally ranges from 0.12 to 0.2 s (3 to 5 mm).
Diagram 3. Interval and PQ segment
In diagram 3 on the right, the interval and segment PQ are marked in different colors.
The PQ segment is defined from the end of the P wave to the beginning of the QRS complex. The PQ segment corresponds to the time when the atria are completely covered by the excitation wave, and the excitation of the ventricles has not yet begun. At this moment, a pause occurs: there are no changes in the electric field of the heart, so the PQ segment is located on the isoline. The pause is associated with a delay in the passage of the electrical impulse through the atrioventricular node to the ventricles.
The physiological meaning of this pause is that at this time the atria are fully contracted and push blood into the relaxed ventricles. Subsequently, excitation and contraction of the ventricles and release of blood into the systemic and pulmonary circulation will occur (the QRS complex is recorded on the cardiogram).
What is the difference between a syndrome and a phenomenon?
Many patients, having seen the concepts of the phenomenon or CLC syndrome in the ECG conclusion, may be puzzled which of these diagnoses is worse. The CLC phenomenon, subject to a correct lifestyle and regular monitoring by a cardiologist, does not pose a great danger to health, since the phenomenon
– this is the presence of signs of PQ shortening on the cardiogram, but without clinical manifestations of paroxysmal tachycardia.
Syndrome
CLC, in turn, is an ECG criterion that is accompanied by paroxysmal tachycardia, most often supraventricular, and can cause sudden cardiac death (in relatively rare cases). Typically, patients with short PQ syndrome develop supraventricular tachycardia, which can be quite successfully stopped at the stage of emergency medical care.
Why does short PQ syndrome occur?
As already indicated, the anatomical substrate of this syndrome in adults is a congenital feature, since additional conduction bundles are formed in the prenatal period
. People with such bundles differ from ordinary people only in that they have an additional tiny “thread” in the heart, which takes an active part in conducting the impulse. But how the heart behaves with this beam will be discovered as the person grows and matures. For example, in children, CLC syndrome may begin to manifest itself both in infancy and adolescence, that is, during the rapid growth of the body. Or it may not manifest itself at all, remaining only an electrocardiographic phenomenon throughout adult life until old age.
No one can name the reason why the syndrome begins to manifest itself as paroxysmal tachycardia. However, it is known that in patients with organic pathology of the myocardium (myocarditis, heart attack, hypertrophic cardiomyopathy, heart disease, etc.) attacks of tachycardia occur much more often and clinically occur with a more pronounced clinical picture and with a severe general condition of the patient.
But the provoking factors that can cause paroxysm can be listed:
- Physical activity that is significantly or not significantly greater than the patient’s usual physical activity,
- Psycho-emotional stress, stressful situation,
- Hypertensive crisis,
- Eating large amounts of food at one time, drinking very hot or very cold liquids,
- Visiting a bathhouse, sauna,
- Changes in external temperatures, for example, going out into severe frost from a very hot room,
- Increased intra-abdominal pressure, for example, during severe coughing, sneezing, defecation, pushing during childbirth, lifting heavy objects, etc.
ST segment
The ST segment is determined from the end of the QRS complex to the beginning of the T wave. This period corresponds to the time when the ventricles are completely covered by the excitation wave, and their relaxation (repolarization) is just beginning.
Scheme 5. Formation of the ST segment
The point at which the QRS becomes ST is called the J point.
An increase or decrease in the ST segment relative to the isoline may be associated with ischemia, infarction, or other pathology. The deviation of ST from the isoline is usually measured at the J point, as well as at the ST60 point (at a distance of 0.06 s or 1.5 mm from the J point) and at the ST80 point (at a distance of 0.08 s or 2 mm from the J point).
The following ST segment deviations are considered acceptable (normal).
- ST depression measured at the J and ST80 points should normally be less than 0.5 mm in V2-V3 and less than 1 mm in the remaining leads.
- ST elevation measured at points J and ST80 should normally be less than 2 mm in V2-V3 and less than 1 mm in other leads.
ECG 2 above shows fragments of leads II and III with a normal ST segment location. ECG 3 in the same leads recorded ST elevation in combination with pathological Q, which indicates the development of infarction of the lower parts of the left ventricle.
The issues of the position of the ST segment in relation to the isoline and the diagnostic assessment of different types of depression or ST elevation are discussed in more detail in other sections.
How does short PQ syndrome manifest?
The clinical picture of shortened PQ syndrome is caused by the occurrence of paroxysmal tachycardia, since during the interictal period the patient usually does not present any complaints from the cardiovascular system. Symptoms of tachycardia are the following:
- The sudden, sharp onset of an attack, caused by provoking factors or occurring without them, in itself,
- Feeling of a strong heartbeat, sometimes with a feeling of interruptions in the heart,
- Autonomic manifestations - severe weakness, hyperemia or paleness of the face, sweating, coldness of the extremities, fear of death,
- Feeling of suffocation or lack of oxygen, feeling of insufficient inspiration,
- Unpleasant discomfort in the heart area of a pressing or burning nature.
If the symptoms described above appear, you should definitely seek medical help by calling an ambulance or going to a clinic.
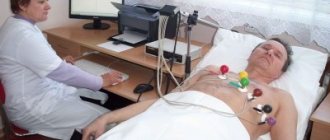
Diagnosis of shortened PQ
The diagnosis is established after recording an ECG and interpreting its data by a doctor. The main ECG signs of CLC syndrome:
- Increased heart rate - 100-120 per minute or more, sometimes reaching 200 beats per minute,
- Shortening of the PQ interval between the P wave and the ventricular QRST complex is less than 0.11-0.12 seconds,
- Unchanged ventricular complexes in case of supraventricular tachycardia, and dilated, deformed - in case of ventricular tachycardia, which is a life-threatening condition,
- Correct sinus rhythm in supraventricular tachycardia.
After the diagnosis has been established and the paroxysm has been relieved, the patient is prescribed an additional examination to exclude gross cardiac pathology (heart defects, myocarditis, heart attack, etc.). Of these, the use of the following is justified:
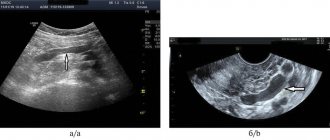
- Ultrasound of the heart,
- Installation of an ECG monitor during the day,
- Examination of the electrocardiogram after physical activity (stress tests using bicycle ergometry, treadmill, tests with a load of pharmacological drugs),
- TEE, or transesophageal electrophysiological study and electrical stimulation of the heart muscle by inserting a probe into the esophagus,
- In especially unclear clinical cases, endovascular or intravascular EPI (endoEPI).
The plan for further examination and treatment of the patient is determined only by the attending physician.
Increased PQ on the holter to 224 during the day and to 228 at night
Alexander
672 views
December 13, 2020
The question is, how can we continue to live with this? I read it and somehow felt uneasy. Is it possible to play sports? Now I train 3 times a week for an hour and a half in the gym at a heart rate of 105-115 between sets, 135-145 immediately after a set, but not always so high, sometimes lower. I feel normal, my heart doesn’t hurt. I’ve been training for about 8 years, until this year, two years ago I just walked 10 km every day at a speed of 7-7.5 km/h, then I started with boxing, started running 5 km, warm-up, training 2 hours 3 times a week, then 3 years added a gym back, iron without fanaticism 2 times a week. Now only the gym 3 times, boxing is gone due to the pandemic, I don’t know if it will come back) There are extrasystoles almost every day, but it’s impossible to confuse atrial ones, when I once had ventricular ones. the ventricular ones were due to alcohol intake, which I abused at one time. Since I was about 30 years old, I remember on the holter it was 900 per day, there was no more than this number. For the last three years, 39-42 years, I was a heavy drinker, 3-5 days on a binge, then a three-week to a month and a half break. I stopped drinking after my rhythm was disrupted, it was beating randomly for 36 hours, I called an ambulance and I was in the hospital for a week. After this incident, I have not drunk alcohol at all for 11 years. Healthy lifestyle: height 185, weight 78, I always keep my weight within this limit +-1 kg, athletic build. There are few extrasystoles, approximately from 1 to 20 per day. They occur extremely rarely under load, mainly at rest or at moments when the heart slows down from high to low, usually if the load was without warming up. That is, I just took it and did 15 pull-ups without preparation, the heart begins to slow down the rhythm very quickly after the approach and can stop once. But it also depends heavily on breathing. If you breathe with your stomach, nothing will happen, if you breathe with your chest, it may interrupt, but this is not a rule, it’s just that maybe, say, 10% out of 100, or maybe less. That is, this can happen, but mostly it interrupts the rest. If there was a warm-up, then this will not happen. And yes, at rest my pulse is 55-58 when I’m sitting watching TV, but I don’t feel it, sometimes it’s 53 and I feel weird, but I don’t feel it, it’s just the clock showing. Now on non-training days I walk 10 km in 1h.20m, that is, 7.5 km.h. fast walk. There is no shortness of breath. The first 5 km, the pulse is 90 at the beginning and 108-112 at the end, the second five at the end 125-133. Then walk to the seventh floor via a step and everything is fine. I quickly return to normal, within 10-15 minutes my pulse is already 70. It’s the increase in PQ on the holter that worries me. Should I change my lifestyle, I mean exercise? Thank you.
The question is closed
Increased PQ on the holter to 224 during the day and to 228 at night
Treatment of short PQ syndrome
- The shortened PQ ,
also called the CLC phenomenon, does not require treatment. It is quite enough to correct the lifestyle and undergo regular examinations with a doctor - a cardiologist or arrhythmologist, for a child - once every six months, for adults - once a year.- Treatment of shortened PQ syndrome
(CLC - Clerk-Levi-Christesco syndrome) consists of providing first aid at the time of tachycardia paroxysm and further taking prescribed medications.
First aid can be provided by the patient independently - this is the use of vagal tests.
These manipulations are based on a reflex effect on the vagus nerve, which slows down the heart rate. Vagal tests can be used at the time of paroxysm only if the patient has had an attack of tachycardia not for the first time, he has been diagnosed and has not previously had ventricular tachycardia. In addition, vagal tests should be explained to the patient in detail by the doctor. The most effective techniques include the following:
- Straining test (Valsalva maneuver),
- Simulating a cough or sneeze
- Lowering your face into a basin of cold water, holding your breath,
- Apply finger pressure with moderate force to closed eyeballs for three to five minutes.
Restoring the correct heart rhythm
is performed by a doctor or paramedic in an ambulance and is carried out through the administration of medications intravenously. As a rule, this is asparkam, verapamil or betaloc. After hospitalization of the patient in a cardiology hospital, treatment of the underlying heart disease, if any, is carried out.
“cauterization” of pathological pathways using RFA
In case of frequent attacks of tachyarrhythmia (several per month, per week), as well as a history of ventricular arrhythmias, a hereditary history of sudden cardiac death or death from cardiac causes in young people, the patient is indicated for surgical treatment.
The operation involves applying radio frequencies, a laser or a cold factor to an additional beam. Accordingly, radiofrequency ablation (RFA), laser destruction or cryo-destruction are performed. All indications and contraindications are determined by an arrhythmologist, cardiologist and cardiac surgeon.
Many patients are interested in the possibility of permanent pacing. An pacemaker can be installed if the patient has a tendency to paroxysmal ventricular tachycardia, ventricular fibrillation and there is a high risk of clinical death with cardiac arrest (asystole). Then you can consider installing a cardioverter-defibrillator, which, unlike an artificial pacemaker, does not impose the correct rhythm, but “restarts” the heart when such fatal arrhythmias occur.
ECG contour analysis
A special feature of electrocardiography using the Medscanner BIORS workstation and the Medscanner Wellness software is the possibility of contour analysis of the ECG. This module is designed to find special points on the ECG graph that are diagnostically important, as well as to calculate the parameters of the cardiogram. Using the data obtained, one can judge about disturbances in the functioning of the heart.
The type of ECG of a healthy person depends on his physique, degree of fitness and other factors, but the sequence and position of certain teeth and segments are normally always the same. To evaluate the ECG, the wave height, displacement and duration of the segments are compared with normal values.
To successfully work with the contour analysis module, you must understand the basic principles of the structure of a cardiac signal. A standard ECG graph consists of many repeating, similar segments called cardiac intervals. In turn, each cardiac interval consists of a set of peaks and troughs (teeth), which reflect the work of the heart over a certain period.
ECG indicators
The ECG graph distinguishes between segments, waves and intervals. A segment is a straight line segment (isoline) between two adjacent teeth. The teeth are designated by the Latin letters P, Q, R, S, T - in the order of their appearance from left to right. They can be negative (Q or S; T or P waves can also be negative), i.e. below the isoline, or positive (T, P, R,) - above the isoline. The interval consists of a tooth (a complex of teeth) and a segment. Thus, interval = tooth + segment. The PQ and ST segments are of greatest importance for diagnosis, and the most important intervals are PQ and QT.
P wave
The P wave is the contraction of the atria. It registers first; This is a small, flat, round deflection that precedes a jagged QRS complex. The condition of the atria is best seen in leads V1 and V2, since the chest leads, unlike the standard ones, are located close to these parts of the heart. The initial part of the P wave corresponds to the excitation of the right atrium, the middle part corresponds to the end of this process and the beginning of excitation of the left atrium, the final part is generated by the left atrium.
Normally, in leads I, II, aVF, V2–V6, the P wave is always positive. In leads III, aVL, V1, the P wave can be positive or biphasic (part of the wave is positive, part is negative). In lead aVR, the P wave is always negative.
The normal duration of the P wave does not exceed 0.1 s, and its amplitude (height) is 1.5–2.5 mm or up to 0.25 mV (with standard calibration, 1 mV corresponds to 10 mm). Usually, when these parameters of the P wave deviate from the norm, we are talking about atrial hypertrophy.
The P wave may be jagged at the apex, but the distance between the teeth should not exceed 0.02 s. The excitation time of the right atrium is measured from the beginning of the P wave to its first apex (no more than 0.04 s). The time of excitation of the left atrium is from the beginning of the P wave to its second apex or to the highest point (no more than 0.06 s).
With severe damage to the atrial muscles, this tooth usually decreases, lengthens and splits. With the so-called atrial fibrillation, when the atria contract frequently and chaotically, instead of the P wave, random fluctuations of the isoline are visible.
PQ interval
The PQ interval is the distance (time interval) from the beginning of the P wave to the beginning of the Q wave (or the R wave, if there is no Q wave - then we are talking about the PR interval). This interval corresponds to the time of passage of excitation through the atria and atrioventricular node to the ventricular myocardium. The PQ (PR) interval depends on age, body weight, and heart rate. It lengthens with AV block and shortens with WPW syndrome.
Normally, the PQ interval is 0.12-0.18 (up to 0.2) seconds (6-9 cells). With age, the PQ interval lengthens.
The ratio of the duration of the P wave to the duration of the PQ segment is called the Macruse index . Normally, the Makruse index is 1.1-1.6. This index is used in the diagnosis of atrial hypertrophy.
QRS complex
The QRS complex is a ventricular complex that is recorded during the excitation of the ventricles of the heart. This is the largest complex on the ECG. It has several pointed teeth - both positive (directed upward) and negative (directed downward).
Point N is the transition from the isoline to the Q wave (Beginning of the QRS complex). Point J is the transition of the S wave to the ST segment (end of the QRS complex).
The width of the QRS complex indicates the duration of excitation in the ventricles and is normally 0.06-0.08 (up to 0.1) seconds. The width of the QRS complex decreases slightly as the heart rate increases, and vice versa. The shape of the complex can change with extraordinary contraction (extrasystole) and other conduction disturbances. Widening of the QRS complex is observed, for example, with bundle branch blocks.
Q wave
The Q wave (the initial wave of the QRS complex) is recorded during excitation of the left half of the interventricular septum. It must be present in chest leads V4, V5, V6. The Q wave should not be recorded in chest leads V1, V2, V3 (otherwise it indicates heart damage). Normally, the width of the Q wave should not exceed 0.03 s. The amplitude of the Q wave in each lead should be less than 1/4 of the amplitude of the next R wave in the same lead and not exceed 0.2 mV - with the exception of standard lead III. A normal Q wave should not be jagged.
R wave
The R wave (the main ECG wave) reflects the excitation of the ventricles of the heart. The amplitude of the R wave in standard and enhanced limb leads depends on the location of the electrical axis of the heart.
This wave, like Q, can be recorded in all standard and enhanced limb leads. From V1 to V4 its amplitude increases: RV4>RV3>RV2>RV1 (in this case, the RV1 wave may be absent), and then decreases in V5 and V6. In standard and enhanced leads in adults, the R amplitude in each of these leads should not exceed 2 mV (in lead I - 1.5 mV). In any of the chest leads, the amplitude of the R wave should not exceed 2.5 mV.
S wave
The S wave (non-permanent wave) reflects the final excitation of the base of the left ventricle of the heart. It is the deepest negative wave on the ECG. Gradually decreases from V1 to V6, may be absent normally in leads V5, V6. The S wave can have different amplitudes, but in leads I, II, aVF should not exceed 0.5 mV.
ST segment
The ST segment is very important for identifying cardiac damage. It is analyzed especially carefully in case of IHD (coronary heart disease), since it reflects the lack of oxygen (ischemia) in the myocardium. The ST segment is measured from the J point to the beginning of the T wave. On the ECG, the J point (from the word junction) can be determined by the change in the slope of the vertical curve of the end of the QRS complex and its transition to a horizontal position - the initial part of the ST segment.
Elevation (excess above the isoline) of the segment is normal:
In the limb leads - up to 0.1 mV, V1-V2 - up to 0.3 mV, in V5-V6 - up to 0.2 mV.
Depression (decreased below the isoline) of the ST segment is normal:
In limb leads - up to 0.05 mV.
The ST segment displacement is estimated using the J+60 or 80 ms rule (depending on the pulse rate). A ST segment deviation lasting 0.06–0.08 s, starting from the J point, is considered diagnostically significant.
T wave
The T wave reflects the process of repolarization (restoration of the original resting potential or resting phase) of the ventricular myocardium. It begins, as a rule, on the isoline, where the ST segment passes into it. The T wave is normally not serrated, its anterior part is flatter. Normally, the T wave is always positive in I, II, aVF, V2-V6, with TI > TIII, and TV6 > TV1. In aVR the T wave is always negative. The amplitude of the T wave (no standards have been developed) in standard and enhanced leads is usually 0.3–0.6 mV (up to 0.8), should be no less than 1/8 and no more than 2/3 of the amplitude of the previous R wave. Duration of the wave T ranges from 0.16 to 0.24 s and does not have much diagnostic value.
QT interval
The QT interval is called electrical ventricular systole, because at this time all parts of the ventricles of the heart are excited. This is the time from the beginning of the QRT complex to the end of the T wave. Its duration depends on gender, age, and heart rate. Normally, the QT interval is no more than 50% of the previous RR interval. Using Bazett's formula, you can determine whether the QT interval is normal or pathological in a particular case (the QT interval is considered pathological if it exceeds a value of 0.42):
QTb= QT (measured by ECG) / √(RR) (interval measured by ECG between two adjacent R waves)
A possible reason for prolongation of the QT interval is hypokalemia (hypocalcemia), while shortening is due to hyperkalemia (hypercalcemia).
T-P interval
This is the interval from the end of the T wave to the beginning of the P wave. It corresponds to the period of relaxation of the heart (straight line on the ECG).
Electrical axis of the heart
Standard leads of cardiac electrical impulses from the surface of the body record the difference in biopotentials between two limbs. The first standard is the potential difference between the left and right hands. The second standard is between the left leg and right hand. The third standard is between the left leg and left arm (negative electrode). These three leads form an equilateral triangle (called Einthoven's triangle) with the vertices on the limbs on which the electrodes are installed. In its middle is the electrical center of the heart, which is equidistant from all leads.
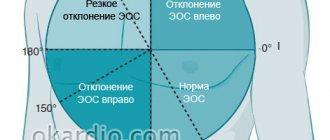
The electrical axis of the heart (EOS) is the projection of the resulting vector of excitation of the ventricles in the frontal plane. The direction of EOS shows the total magnitude of bioelectrical changes occurring in the heart muscle with each contraction. The position of the axis serves only as an additional indicator in diagnosing a particular disease.
The direction of the EOS is expressed in degrees of angle alpha. The alpha angle is formed by the EOS and a horizontal line drawn through the conditional electrical center of the heart, i.e. axis of lead I shifted to the center of Einthoven’s triangle.
In healthy people, depending on their body type, the alpha angle ranges from 0° to +90°. There are three options for the constitutionally determined provision of EOS:
- normal - alpha angle from +30° to +70°;
- horizontal - alpha angle from 0° to +30° (often with a hypersthenic body type);
- vertical - alpha angle from +70° to +90° (occurs with asthenic body type).
Normally, the electrical axis of the heart in persons over 40 years of age is located at an angle from –30 to +90, in persons under 40 years of age - from 0 to +105. A condition in which the electrical axis of the heart is deviated is not a diagnosis in itself. However, such changes in the electrocardiogram may indicate various disturbances in the functioning of the heart. Most often, deviation of the electrical axis of the heart is associated with ventricular hypertrophy, however, to clarify the nature of the pathology, it is necessary to analyze other parameters. For example, deviation of the EOS to the left may indicate hypertrophy or overload of the left ventricular myocardium. Deviation of the EOS to the right may indicate hypertrophy or overload of the right ventricle. This condition is a sign of a long-standing chronic process and, as a rule, does not require emergency help from a cardiologist. However, the danger is posed by changes in the electrical axis due to His bundle block. This situation requires urgent intervention by a cardiologist and treatment in a specialized hospital.
Heart rate analysis
Rhythm regularity is assessed by RR intervals. If the teeth are equally spaced from each other, the rhythm is called regular or regular. The spread of the duration of individual RR intervals is allowed no more than ± 10% of their average duration. If the rhythm is sinus, it is usually regular.
Sinus rhythm
This is a normal rhythm, and all other rhythms are pathological (i.e., indicate disturbances in the functioning of the heart). The source of excitation is located in the sinoatrial node . Signs on the ECG:
- in standard lead II, the P waves are always positive and are located before each QRS complex,
- P waves in the same lead have the same shape at all times.
P wave in sinus rhythm
Atrial rhythm
If the source of excitation is located in the lower parts of the atria, then the excitation wave propagates to the atria from bottom to top (retrograde), therefore:
- in leads II and III the P waves are negative,
- There are P waves before each QRS complex.
The atrial rhythm is pathological. It is characterized by the fact that the source of excitation is located in the lower parts of the atria, and the excitation wave propagates to the atria from bottom to top (retrograde), therefore, in leads II and III, the P waves are negative.
P wave in atrial rhythm
Rhythm from AV connection
If the pacemaker is located in the atrioventricular ( atrioventricular ) node, then the ventricles are excited as usual (from top to bottom), and the atria are excited retrogradely (i.e. from bottom to top). At the same time, on the ECG:
- P waves may be absent because they are superimposed on normal QRS complexes,
- P waves can be negative, located after the QRS complex.
Rhythm from the AV junction, superimposition of the P wave on the QRS complex.
Rhythm from the AV junction, the P wave is located after the QRS complex.
Heart rate with a rhythm from the AV junction is less than sinus rhythm and is approximately 40-60 beats per minute.
Ventricular (idioventricular) rhythm
In this case, the source of rhythm is the ventricular conduction system. Excitation spreads through the ventricles in the wrong way and is therefore slower.
Features of idioventricular rhythm:
- QRS complexes are widened and distorted. Normally, the duration of the QRS complex is 0.06–0.10 s, and with this rhythm the QRS duration exceeds 0.12 s.
- the relationship between QRS complexes and P waves is not fixed because the AV junction does not release impulses from the ventricles, and the atria can be excited from the sinus node as normal.
- Heart rate less than 40 beats per minute.
Idioventricular rhythm. The P wave is not associated with the QRS complex.
Conducting contour analysis
To facilitate analysis, it is advisable to enable the “Smoothing” and “50 Hz Filter” parameters in the settings when recording. It is enough to record using 3 leads.
The accuracy of the analysis largely depends on the selected ECG section, so you should choose the cardiac interval that is free of interference and artifacts.
The program automatically determines measurement control points, however, the choice of program may be incorrect due to the complexity of calculations and the vagueness of the ECG form.
Therefore, you should adjust the position of the markers (position of the teeth), characteristic diagnostic points on the curve, by moving them with the mouse.
The accuracy of diagnosis greatly depends on how correctly the markers are placed. It is also worth keeping in mind that contour analysis takes into account only the basic characteristics of the ECG, and therefore cannot be the basis for making a clinical diagnosis. If there is any suspicion of a disease of the cardiovascular system, the ECG must be interpreted by a cardiologist.
Is it possible to develop complications when PQ is shortened?
The phenomenon of shortened PQ cannot lead to any complications. Due to the fact that the manifestation of PQ syndrome is an attack of tachyarrhythmia, there will be corresponding complications. These include the occurrence of sudden cardiac death, fatal arrhythmias (ventricular fibrillation), thromboembolism of the cerebral and pulmonary arteries, the development of myocardial infarction, arrhythmogenic shock and acute heart failure. Of course, not every patient develops such complications, but everyone needs to remember them. Prevention of complications is timely seeking medical help, as well as timely surgery if indications for it are discovered by a doctor.
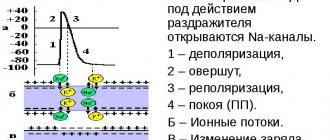
Ventricular depolarization - QRS complex
From the atrioventricular node, the excitation wave propagates through the conduction system of the ventricles. This causes depolarization (excitation) of the ventricles. The ventricular QRS complex is recorded on the cardiogram at this time.
In diagram 4 on the left, the propagation of the excitation wave through the ventricles is shown in yellow; the red color shows that at the same time repolarization (restoration) of the atria occurs. On the right side of diagram 4, the ECG highlights the QRS complex, which is recorded during this period. Atrial repolarization is not visible on the cardiogram due to the “overlay” on the QRS complex.
Scheme 4. Ventricular depolarization and formation of the QRS complex on the cardiogram
The parameters of the QRS complex are normal:
- The QRS duration ranges from 0.07 to 0.1 s (1.5 to 2.5 mm).
- The QRS amplitude must be at least 5 mm in at least one limb lead, and more than 8 mm in at least one chest lead.
- The QRS amplitude in the limb leads should not exceed 22 mm, and 25 mm in the chest leads.
Q wave
The Q wave of the QRS complex reflects excitation of the interventricular septum. This is a non-permanent ECG wave. Normally, the Q wave may be recorded or absent in the limb leads and in the chest leads V4-V6. Registration of Q in leads V1-V3 always indicates pathology.
Normal Q wave parameters:
- Q depth < 2 mm in leads I, II, aVL, aVF, V4-V6.
- The Q depth may be more than 2 mm in leads III, aVR.
- Width Q < 1 mm.
ECG 2. Examples of a normal Q wave in leads II and III
Parameters of the pathological Q wave:
- Q depth > 2 mm, and also if the amplitude of the Q wave exceeds 25% of the amplitude of the following R wave.
- Width Q > 1 mm.
- Any Q in leads V1-V3 is considered pathological.
The presence of a pathological Q wave on the cardiogram usually indicates myocardial infarction.
ECG 3. Examples of pathological Q wave and ST segment elevation in leads II and III
R wave
The R wave reflects the initial stage of depolarization (excitation) of the ventricles. The amplitude R in the limb leads is determined by the position of the EOS. In the chest leads, the amplitude R increases from V1 to V4, and then in V5 and V6 it becomes smaller. Normally, especially in young people, the r wave may be absent in leads V1, V2. In this case, QRS type QS is recorded on the ECG. However, in this case there should be caution, because the QS complex may be a manifestation of myocardial infarction.
S wave
The S wave reflects the final stage of ventricular depolarization - excitation of the base of the left ventricle. This is a non-permanent ECG wave. In the chest leads, the S wave usually has its greatest amplitude in V1-V2, which decreases towards V5-V6.
Forecast
Determining the prognosis for patients with CLC syndrome is always difficult, since it is not possible to predict in advance the occurrence of certain rhythm disturbances, the frequency and conditions of their occurrence, as well as the occurrence of their complications.
According to statistics, the life expectancy of patients with short PQ syndrome is quite high, and paroxysmal rhythm disturbances most often occur in the form of supraventricular rather than ventricular tachycardias. However, in patients with underlying cardiac pathology, the risk of sudden cardiac death remains quite high.
The prognosis for the phenomenon of shortened PQ remains favorable, and the quality and life expectancy of such patients do not suffer.