What is the ST segment?
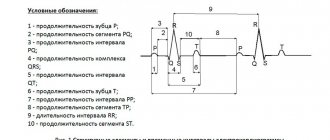
An ECG shows the electrical processes that occur in the heart muscle during contraction and relaxation. If you look at the result of the study, you can see a line with many teeth. A straight segment is called an isoline, and the distance between two adjacent teeth is called a segment.
The ST segment represents the interval from the end of the S wave to the beginning of the T wave. This segment shows the state of the heart muscle at the time of contraction of both ventricles. Normally, the segment lies completely on the isoline and does not deviate from it. If the segment is located below the isoline, then doctors talk about depression of the ST segment.
Does this indicate a dangerous heart pathology? It all depends on the degree and type of segment decline. The electrocardiograph records the examination results on checkered paper. If the ST segment is located no more than half a cell below the isoline, then this is a variant of the norm and occurs in healthy people. This result is considered acceptable in both precordial and limb leads. A stronger decrease in the segment may indicate cardiac pathology.
ECG No. 2
Let's look at another ECG with an inferior infarction. Do not pay attention to the small tremor in leads V1-V2 - these are artifacts and they do not mean anything.
of elevation is highlighted in red of reciprocal depression in green . Yellow is also a reciprocal change, but due to the presence of a complete block of the right bundle branch (I hope you noticed it), this statement can be disputed.
Why is the ST segment reduced?
The causes of ST segment depression are divided into coronary and non-coronary. Coronary causes include conditions associated with insufficient blood supply (ischemia) to the heart muscle. These are different types of coronary heart disease and myocardial infarction. Non-coronary causes include:
- lack of potassium in the body (hypokalemia);
- secondary myocardial lesions in non-cardiac pathology;
- paroxysmal supraventricular tachycardia (ST segment depression can be up to 8 mm);
- taking certain medications (cardiac glycosides, antiarrhythmics, phenothiazines);
- hypertrophy of the left ventricle of the heart;
- vegetative dystonia;
- mitral valve prolapse;
- emotional stress;
- intense breathing (hyperventilation).
ECG No. 3
Well, another ECG with a lateral wall infarction (I, AVL, usually there is also V5-V6, but not always), I think explanations are unnecessary.
ECG No. 4
And the last ECG with anterolateral infarction. There is some isoline drift here, so I chose the most “clean” area for measurements.
In general, this material is sufficient for our modest purposes. And you can try to complete the task to consolidate the material you have covered. TASK 5.3
Or, if you prefer, let’s move on to “Scar Changes”
If you find any error, please select a piece of text and press “ Ctrl+Enter”
Oblique and horizontal type of decline
If the segment between the teeth is an oblique line directed downwards, then in this case they speak of oblique depression of the ST segment. Such electrocardiogram readings are considered pathological. This indicates myocardial ischemia. Another reason for this result may be left ventricular failure.
A sign of insufficient blood supply to the heart muscle is horizontal depression of the ST segment. What it is? The segment between the S and T teeth is parallel to the isoline. This ECG result is also a marker of ischemia.
The status of the ST segment is checked in two adjacent leads. That is, the electrodes of the cardiograph are connected to two points located nearby, on the chest or on the limbs. And if a decrease in the segment was detected twice, then this, as a rule, indicates ischemia.
Now, regarding ST elevation infarction
The most important criterion, along with elevation, is reciprocal changes - ST depression
in leads opposite to the area of infarction.
That is, if there is elevation somewhere, then somewhere nearby there must be depression . In rare cases, reciprocal changes occur in those areas that are not visible on regular ECGs, but let’s agree right away - you send all patients with ST elevation and related complaints to hospitalization immediately or present them to a cardiologist.
Situations in which you can solve the problem yourself are limited to cases when you have an ECG on hand for comparison. That is, you can say with 100% confidence that the ECG looked like this before, for example: cases with post-infarction changes or early repolarization syndrome - we’ll talk about this later.
Now let's go back to the previous ECG. This is a heart attack.
Oblique descent type
Oblique ST-segment depression is a deviation in the electrocardiogram when the line between the teeth is directed upward. This usually happens with tachycardia. This phenomenon may be temporary, for example when your heart rate increases after exercise. In this case, changes in the electrocardiogram do not indicate pathology.
But if a high T wave is observed on the electrocardiogram along with oblique ST segment depression, this may indicate a disease. This ECG result occurs in the acute stage of myocardial infarction, with left ventricular hypertrophy, hyperkalemia.
Clinical manifestations
The clinical picture of ST segment elevation may be different. It depends on the reason that caused the change.
Pain
The most common symptom accompanying ST segment elevation is pain. The intensity of pain, its duration, irradiation (conducting pain to other organs and parts of the body) can vary.
Pain during angina pectoris and myocardial infarction is usually acute and very severe. It is impossible to endure such pain. By nature it can be burning, squeezing, pressing.
The localization of pain can also be different. Most often it is localized behind the sternum, directly in the heart area. If a heart attack affects the lower wall of the heart, the epicenter of pain may be the abdomen, which is why patients mistakenly turn to a gastroenterologist.
Often the pain is not localized in one place, but radiates along the nerves. In this case, pain in the heart can radiate to the left arm, shoulder blade, shoulder, or little finger. Cases have been described where the only symptom of myocardial infarction was pain in the little finger.
One of the main criteria for differentiating pain during angina pectoris and pain during myocardial infarction is time. Pain during angina pectoris lasts no more than 15 minutes; in all other cases, a heart attack should be suspected.
Pain from pericarditis is usually similar to pain from myocardial infarction. It has the same localization, the same areas of conduction. It is characterized by intensification in a horizontal position (lying down), when eating or drinking water (swallowing is especially difficult for patients), and when coughing. Sometimes there is an increase in pain during breathing.
Dyspnea
Dyspnea is the equivalent of pain in conditions accompanied by ST segment elevation on the ECG. It can occur at rest or during physical activity. This symptom can occur with myocardial infarction, myocarditis, or cardiac aneurysm.
Fever (increased body temperature)
This nonspecific symptom accompanies many human diseases, and ST segment elevation can also manifest itself as an increase in body temperature.
Excessive sweating
It is observed in myocardial infarction, aneurysm and other conditions accompanied by ST segment elevation on the ECG.
Heart rhythm disturbances
This symptom can be subjectively felt as increased or, conversely, weakened heartbeat, interruptions in heart function.
Weakness
General weakness and weakness of skeletal muscles may also indicate the presence of heart disease accompanied by ST segment elevation.
Asymptomatic
In some cases, ST elevation may not manifest itself clinically. This situation is especially dangerous, since some conditions accompanied by ST segment elevation on the ECG are often life-threatening and require emergency medical care.
ST segment displacement. Electrocardiogram of the heart. Toolkit
ST segment displacement is considered as a result of excitation disorder due to damage to individual parts of the myocardium. These disorders can be transient (angina attack, acute coronary syndrome with unstable ST elevation, pre-infarction state) or persistent (myocardial infarction - elevation, myocardial hypertrophy - depression).
Depression of the ST interval is distinguished as reflected (reciprocal, discordant) changes with damage to the myocardium of the opposite parts. For example: ST depression in standard I, aVL, V2, V4 with infarction of the posterior wall of the left ventricle and left ventricular hypertrophy with hypertensive disease. In the first case, the depression will be horizontally directed parallel to the isoline. With hypertrophy, the depression of the segment will be oblique, less pronounced starting from the S wave and more pronounced as it approaches the T wave. As a result of such depression, together with the first (negative) phase of the T wave, it (segment) forms an isosceles triangle, the shape of which resembles a blockade of the left leg His bundle. The difference is that with blockade the QRS complex will be widened (> 0.10 sec). Another difference between depression during hypertrophy and reciprocal depression is that it is persistent and does not change in the near future under the influence of medications: therapy with anticoagulants, thrombolytics, nitroglycerin test, after stopping an attack of angina, etc.
Many years of experience in the cardiological ambulance service in Yekaterinburg (50 years old in 2010) have convinced us that if an ECG taken during a painful attack or immediately after it shows even minor changes, in particular in the ST segment, then they deserve the most serious attention, even if these displacements are 1 - 2 mm, although this contradicts the statements of the authors of many ECG manuals. The remark concerns, first of all, the disposition of the ST segment, when there is still no classical elevation, but it is no longer horizontal. The initial part of the segment - point J is on or almost on the isoline, but the final part tends to merge with the T wave, which is why the T wave is not so clearly visible, the depression between it and the final part of the segment appears smoothed. As confirmed by our long-term observations (V.A. Fialko, V.I. Belokrinitsky), later continued by our interns, these changes should be considered as the earliest manifestations of myocardial ischemia, which can be transient (Fig. 19). We called this phenomenon “oblique ST.” Under the influence of adequate therapy, such a displacement can undergo reverse development, i.e. the ST segment will become isoelectric; in those cases when the pathological process cannot be prevented, we will get the classic picture of myocardial infarction with elevation, reciprocal changes, etc. Therefore, ignoring the described changes in so-called “small signs” can lead to a disaster.
Nevertheless. V.V. Murashko, A.V. Strutynsky cite this small sign as a variant of the norm [12]. The obliquely ascending ST segment leads to and. Plots [24], however, his J point is located above the isoline, so this form is more correctly considered as a type of ST segment elevation. An oblique segment is also given by V.N. Orlov [8], however, in his illustration, point J is below the isoline. (Fig. 20 a,b,c). Some authors allow a slight (1–2 mm) elevation of the segment (including the J point, as a normal option). In essence, we are talking about classic ST segment elevation, which is a manifestation of acute ischemia, and the difference, according to these authors, is only in the height of the elevation. Perhaps for the conditions of the hospital stage, such a point of view is not significant (the patient is still in the hospital), but not for the stage of an ambulance or clinic! After all, here it is necessary to decide whether these changes are acute or not. Therefore, having met with such a patient and such an electrocardiogram, the doctor of first contact should pay attention first of all to the complaints, compare this attack with those that took place earlier, that is, what is called the history of the attack, and not focus on counting millimeters of elevation, whether it exceeds whether it is the notorious boundaries of the norm or not. One student, during a test on the EMS cycle, said that she witnessed how a young doctor on duty at one of the city’s clinical hospitals refused to see a patient from an ambulance team (the student was on duty as part of this team), arguing her refusal by the fact that ST segment elevation did not exceeded 2 mm!. “Respect” for the notorious millimeters leads to mistakes, which at the pre-hospital stage are sometimes quite expensive for patients. And the doctor, who made a diagnostic, and possibly, following it, a tactical error, during the analysis for LEC, in his own defense, states that this is what is written in the manuals. This is what happens when, instead of in-depth analysis and logical comprehension of all the data obtained, including ECG data, with the dominant role of the clinical picture, they are taught to count millimeters.
Such statements by the doctor require comment. Of course, it is good that doctors read monographs, of which there is now no shortage. But they were written by different authors, whose views may not coincide. The same situation occurs when doctors undergo advanced training in various GIDUVs: different schools, different views.
Therefore, you need to be guided in your work not by the information that you received from monographs or lectures - one today, another tomorrow, but by the principles that are accepted in your institution and approved by standards (protocols).
We think that the thesis about the permissible limit of ST segment elevation would be correct to be stated in the following wording:
“If a patient has no complaints, we emphasize - without any complaints, during an ECG examination, a slight elevation of the ST segment with or without J-point elevation will be recorded as an accidental finding, only in this case such a picture may not cause anxiety. But if an ambulance doctor, a clinic, or a hospital emergency department, when examining a patient for complaints of pain in the chest, epigastrium, back, in the heart area, against the background of a hypertensive crisis with or without shortness of breath, during a differential diagnosis with radiculalgia, finds even slight elevation, or so-called the phenomenon of “oblique ST”, with or without displacement of the J point, especially if these signs were not present on previous electrocardiograms - the data obtained in combination with clinical manifestation should be considered as the earliest manifestations of OCP with appropriate measures taken - reliable pain relief, therapy with antiplatelet agents , anticoagulants, hospitalization.
If, during an examination in a hospital, the initial diagnosis is not confirmed, no claims should be made to the doctor, provided that the call card convincingly describes the course of reasoning, from which it will be clear to the expert why the doctor came to such a diagnosis.
We will try to illustrate what has been said with examples taken from many years of experience in the cardiological ambulance service of our city.
Figure 21 “A” shows the ECG of patient O., 56 years old, recorded by the cardiology team during the first visit.
In the chest leads, the described phenomenon is clearly visible, when there is still no pronounced elevation of the ST segment, but it is not isoelectric, its final part seems to tend to merge with the T wave (See above). For clarity, next to it, in a frame, there is a drawing from the monograph by V.V. Murashko and A.V. Strutynsky [12], which is interpreted as a variant of the norm. This ECG, in combination with the clinical picture, was interpreted as a manifestation of acute coronary pathology. The patient was given heparin and was hospitalized. On the next ECG, taken a day later in the hospital, the segment is noticeably approaching the isoline; the ECG was recorded without a pain attack.
A similar electrocardiogram (patient G., 53 years old) is presented in Figure 22 “B”, with the only difference that the development of the pathological process could not be prevented and on the re-recorded curve a day later (the patient is also in the hospital) we received a convincing picture of myocardial infarction. Analysis of the above changes, according to our data, they occurred in 26.8% of cases, allowed us to conclude that
The described changes in the presence of a pathognomonic clinical picture can be rightfully considered as the earliest manifestations of OCP, which, if ignored, can lead to a catastrophe.
And here's another example.
Patient S., 83 years old. Complaints: pain in the chest, more on the right, radiating under the left shoulder blade. They get worse with movement and deep breathing. The pain has been bothering me for three days, the patient was warmed up and took ibuprofen. Previously, the pain was on the left side, but today it appeared on the right side of the chest. History of osteochondrosis of the thoracic spine. Objective measurement data: number of respirations – 18 per minute, number of ser
daily contractions – 74 per 1 min., blood pressure – 140/90 mmHg. The patient was removed electrically
cardiogram (see Fig. 23). Conclusion: Sinus rhythm, 85 beats. in 1 min., horizontal electrical axis of the heart, diffuse-dystrophic changes in the myocardium. Single ventricular extrasystoles.
Diagnosis: Osteochondrosis of the thoracic region. Intercostal neuralgia. The patient was not provided with assistance (in accordance with the diagnosis). Release of the brigade - 8 o'clock. 49 min. The doctor was on call for 28 minutes. At 9:52 a.m. the call comes again. The team, which arrived without delay, confirmed death before arrival.
Let's analyze the example given. When collecting anamnesis, all attention is paid to the manifestations of osteochondrosis . The coronary history is completely unclear, which cannot be excluded in an 83-year-old patient. In fact, there is no history of the attack; it is not clear whether such attacks have happened before, whether the patient took nitroglycerin and what the effect was. No attempt has been made to carry out a differential diagnosis between ischemic heart disease and osteochondrosis, “which do not exclude both of these pathologies, but can coexist in one patient, mutually influencing each other,” B.P. Kushelevsky, A.N. Kokosov, cited. according to [20]. The doctor also missed the fact that today’s attack was characterized by a change in the localization of pain, which, as is known, should always alert the doctor, since it is a diagnostic criterion; Professor B.P. Kushelevsky pointed this out in his works in the middle of the last century! The electrocardiogram clearly shows the already mentioned phenomenon of “obliquely ascending ST segment, in leads V2 and V3 (especially pronounced in V2). The ST segment is not higher than the isoline, but it is not horizontal either, but tends to merge with the T wave, which is why the latter is less contoured. Point J is on the isoline. No notorious “millimeters” play a role here; there are early manifestations of myocardial ischemia, which led to the patient’s death (as is known, patients do not die from osteochondrosis). One more sign was left unattended: in lead aVL, the jaggedness of the R wave is clearly visible, which, as is known, is a prognostically unfavorable sign of impending myocardial rupture. This sign could have been neglected if the patient had remained alive. However, there is reason to give it significance, which the doctor should have done when analyzing the ECG, meaning an in-depth analysis of the data obtained, linking them with the clinical picture. In the analyzed example, there is a superficial, formal approach to fulfilling the standard (ECG examination) without thoughtful analysis (a faceless, so-called conclusion that says nothing in this situation: “Diffuse-dystrophic changes in the myocardium,” which led to a dramatic final For “amateurs” diagnosing “Osteochondrosis”, instead of thoughtfully carrying out differential diagnosis with ischemic heart disease, it is appropriate to quote the following statement:
“The doctor must remember!!! If there is a history of manifestations of coronary heart disease (CHD) or atherosclerotic vascular lesions of any location, ischemia underlies cardialgia in more than 90% of cases, regardless of age.” [ 19 ].
One should only add to this statement that if there is no indication of ischemic heart disease in the history, this does not mean that it really does not exist, especially if the patient’s age gives grounds for such an assumption.
At one of the lessons on the EMS cycle, after demonstrating the example discussed above, students asked the question: “Why don’t they tell us about this at clinical departments?” The answer lies on the surface: such examples, as well as the rapid dynamics of indicators under the influence of active therapy in the acute period, can only be observed at the emergency stage. This is precisely where the interest in studying the prehospital stage lies.
And it is no coincidence that the opportunity to study this stage at a level close to clinical appeared only with the creation of specialized teams.
Back to section
ECG
ECG benefit
Similar materials
- Conclusion. Educational and methodological manual on ECG - 16/12/2010 05:35
- Scheme of information examination of a patient with OKP - 12/16/2010 04:55
- Electrocardiographic report. Methodological manual - 16/12/2010 04:37
- ECG calculation method - 12/16/2010 04:30
- ECG for various manifestations of acute coronary pathology - 12/16/2010 04:22
New materials
- Electrocardiographic report. Methodological manual - 16/12/2010 04:37
- ECG calculation method - 12/16/2010 04:30
- ECG for various manifestations of acute coronary pathology - 12/16/2010 04:22
Old materials
- Normal electrocardiogram. Special part of the methodological manual - 12/16/2010 03:58
- Analysis of defects when taking an ECG (continued) - 12/15/2010 11:54
- Analysis of defects made during ECG examination - 12/15/2010 11:28
S wave
S wave:
- depth up to 8-12 mm
- duration 0.03 sec
The S wave is the potential being tested; this is the time when the ventricles are completely engulfed in excitation. It has no independent meaning.
The QRS complex is of great importance, which corresponds to intraventricular conduction equal to 0.1 sec, and with hypertrophy it can be up to 0.12 sec. If the QRS complex is more than 0.12 seconds, this is an intraventricular block or a violation of intraventricular conduction.
Next, the depolarization process is completed; on the electrocardiogram this corresponds to the ST interval. This means that the cell membrane is completely recharged.
P wave
The sinus node is located at the junction of the vena cava. During depolarization, the impulse travels through the right atrium, thus forming the ascending limb of the P wave. Thus, if any changes occur in the ascending limb of the P wave, then the problem is in the right atrium.
Next, the impulse travels through the left atrium; on the ECG it is the descending limb of the P wave.
Typically, the ascending and descending limbs of the P wave are symmetrical.
The P wave is responsible for the atria:
- it is always positive, except for those leads where all the waves are negative (aVR, V1)
- height up to 2 mm
- duration up to 0.1 sec
If the P wave grows in the right knee, this is hypertrophy of the right atrium, if in the left knee, this is hypertrophy of the left atrium.
If the P wave is reduced, this indicates atrial dystrophy (decreased atrial myocardial mass).
There is no P wave – the sinus node is not working.
The impulse then goes to the AV junction. There is no depolarization or repolarization. On the ECG this corresponds to the PQ interval - resting potential.
The impulse then goes to the interventricular septum.