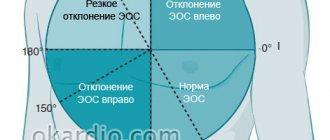
The mean electrical axis of the QRS complex is the basic measurement required for every electrocardiogram. In most healthy individuals it is between -30° and +100°. An angle of -30° or more negative is described as axis deviation to the left , and an angle of +100° or more positive is described as axis deviation to the right . In other words, axis deviation to the left is an altered position of the average electrical axis of the QRS complex in people with a horizontal position of the electrical axis of the heart. Axis deviation to the right is an altered position of the average electrical axis of the QRS complex in people with a vertical position of the electrical axis of the heart.
The position of the average electrical axis of the QRS complex depends on the anatomical position of the heart and the direction of propagation of the impulse through the ventricles (direction of ventricular depolarization).
General information about pathology
Cardiologists see the chest as a three-dimensional coordinate system that contains the heart. Each contraction is accompanied by a number of bioelectrical changes, which change the direction of the cardiac axis.
What is the electrical axis of the heart
The electrical axis of the heart describes the functioning of the organ based on its size and functioning characteristics. It is almost identical to the axis of the organ’s location in the body. The parameter shows the electrical processes that bring the heart muscle to work.
It is checked using an electrocardiogram. Sensors are attached to various areas of the chest and take readings. After which, on the transcript, the doctor determines the axes and sees whether there are any deviations from the norm.
Normal electrical axis of the heart
Normally, the axis of the heart should almost completely coincide with the axis of the location of the organ in the chest. The cardiac muscle is located semi-vertically. The lower part looks down and to the left. Accordingly, the EOS should also be tilted down and to the left.
The alpha angle normally ranges from 0° to 90°.
Vertical position of the EOS
In people with a thin build, tall stature and long limbs, the heart axis may be vertical. The alpha angle will normally range from +70° to + 90°. It is also normal during exhalation and when a person gets up from a horizontal position.
Horizontal position of the EOS
The horizontal position of the EOS is typical for stocky and plump people with short stature. The alpha angle norm will correspond to the range from 0 to +30°.
It also appears when a person lies down and the internal organs put pressure on the diaphragm and at the moment of full inhalation.
What does a sharp deviation mean?
Any deviations more or less from the norm indicate disturbances in the functioning of the heart muscle. A minus angle indicates that the EOS is excessively tilted to the left. Values above +90° indicate a tilt to the right.
Often these values are not indicated in the ECG interpretation. Doctors in conclusion simply write about axis deviation to the left or right.
A sharp deviation in EOS is not a diagnosis in itself, but can be a symptom of problems such as:
- left ventricular hypertrophy;
- disturbances in the functioning of the left ventricular valves, due to which the volume of blood in the department increases;
- failures in electrical conductivity;
- cardiac blockades.
ECG interpretation
Interpretation of ECG results in a child: norms of indicators and causes of violations
Electrocardiography (ECG) is a fast and high-quality way to obtain information about the functioning of the heart.
Often, such an examination is prescribed to children to identify a particular heart disease. It has some differences from the ECG of an adult. Parents of babies should know what this procedure is, how to properly prepare their child for it, and how the cardiogram results are interpreted. In what cases is an ECG prescribed for a child?
The pediatrician prescribes an ECG for children in certain cases. These include:
- heart murmurs;
- dizziness;
- headaches and fainting;
- fast fatiguability;
- pain in the chest area;
- swelling of the limbs;
- frequent infectious diseases;
- preparation for surgery;
- hereditary predisposition to cardiovascular pathologies;
- high pressure;
- endocrine system disorders;
- slow physical development.
Children are also given an ECG before being discharged from the maternity hospital to exclude heart defects and during a routine medical examination before entering kindergarten or school. A cardiac examination is also indicated before starting sports.
Features of the child’s body that should be taken into account during an ECG
The work of the heart in young children has its own characteristics. Compared to the heartbeat of adults, it is much faster in babies. For clarity, below is a table of normal heart rate indicators depending on a person’s age:
| Age | Normal heart rate, beats per minute | Average heart rate, beats per minute |
| 0-1 month | 110-170 | 140 |
| 1-12 months | 102-162 | 132 |
| 1-2 years | 94-154 | 124 |
| 2-4 years | 90-140 | 115 |
| 4-6 years | 86-126 | 106 |
| 6-8 years | 78-118 | 98 |
| 8-10 years | 68-108 | 88 |
| 10-12 years | 60-100 | 80 |
| 12-15 years | 55-95 | 75 |
| 15-50 years | 60-80 | 70 |
| 50-60 years | 64-84 | 74 |
| 60-80 years | 69-89 | 79 |
An ECG in the first year of life does not allow doctors to miss a congenital defect or other heart disease
ECG readings in newborns, infants, and adolescents often differ from normal values. When making a diagnosis, the doctor takes into account the deviations acceptable for each age group. Also, during the procedure, some features of the child’s body are taken into account:
- in infants the right ventricle often predominates, which is not a pathology; this discrepancy disappears with age;
- the younger the child, the shorter the cardiogram intervals;
- the size of the atrium in children is larger than in adults;
- the T wave on the graph of electrical signals from the heart muscle has a negative value;
- rhythm sources migrate within the atria;
- alternans of teeth on the ventricular complex;
- the likelihood of incomplete blockade on the right bundle branch;
- respiratory and sinus arrhythmia;
- possible occurrence of a deep Q wave in the 3rd standard lead.
Norms and interpretation of ECG indicators for children of different ages
The diagnosis is made taking into account indicators such as teeth, segments and intervals. Their presence or absence, height, location, duration, sequence and direction are taken into account.
Heart problems are identified by analyzing the following data:
- Sinus rhythm. This is the rhythmic contraction of the heart muscle under the influence of the sinus node. This indicator allows you to evaluate the nature of contractions of the ventricles and atria.
- Heart rate in children of different ages.
- Source of excitation. It is determined by examining the P wave.
- Cardiac conduction.
- Electric axis. In leads 1 and 3, the Q, R and S waves are analyzed, which makes it possible to evaluate the functioning of the His bundle.
Only an experienced specialist should interpret the results of the electrocardiogram.
Interpretation of ECG results is carried out by a competent cardiologist who knows the specifics of the functioning of the heart in each age group. On the cardiogram, the processes occurring in the heart muscle are indicated by capital letters of the Latin alphabet - P, Q, R, S, T. Each designation on the diagram indicates certain processes:
- ventricular relaxation - T;
- contraction and relaxation of the atria - P;
- excitation of the septum between the ventricles – Q, S;
- ventricular excitation – R;
- duration of passage of an electrical impulse from the atria to the ventricles - PQ;
- relaxation of the heart muscle in the interval between contractions - TP;
- peak excitation of the ventricle – ST;
- the duration of its contraction is QRST.
The psycho-emotional state of the child can negatively affect the accuracy of ECG readings
ECG results can be affected by factors such as the time of day, the psycho-emotional state of a small patient, food intake, incorrect application or displacement of electrodes, and interference from operating foreign devices. The following indicators are normal for a child:
- for QRS – 0.06–0.1 s;
- for P – ≤ 0.1 s;
- for PQ – 0.2 s;
- for QT – ≤ 0.4 s.
ECG results often indicate a poor cardiogram with deviations from the norm. In this case, if necessary, the child is prescribed an additional examination, and then the optimal treatment method is selected.
Possible causes of rhythm disturbances and other parameters on the ECG in a child
Electrocardiography in children often reveals heart rhythm disturbances. The causes of disorders are divided into cardiac and extracardiac. The first type of factors provoking arrhythmia include:
- birth defects;
- autoimmune and other pathologies of the heart;
- heart tumors and injuries;
- severe infectious diseases;
- anomaly of organ development;
- carrying out probing and contrast X-ray examination of blood vessels.
ECG allows timely detection of heart rhythm disturbances
Extracardiac causes of arrhythmia are pathologies of the nervous and endocrine systems, blood diseases, and premature birth. Intense exercise also makes the heart rhythm irregular. Along with this, high air temperature, emotional stress and the simultaneous course of heart disease and failure of the neurohumoral regulation of the heart can provoke arrhythmia.
Electrocardiography often records tachycardia (we recommend reading: how does sinus tachycardia manifest itself in children on an ECG?). The cardiac causes of the disease are similar to the factors that provoke the development of arrhythmia. Extracardiac sources of the disease include:
- acidosis;
- low blood sugar levels and disturbances in its electrolyte composition (we recommend reading: what is the normal blood sugar level for a 12-year-old child?);
- diseases of the endocrine system;
- tonsillitis and conditions arising after a sore throat;
- neurotoxicosis;
- intoxication syndrome with elevated temperature;
- side effects of a number of medications.
In accordance with the ECG results, the pediatric cardiologist prescribes the necessary treatment
An ECG can detect bradycardia. Among the most common causes of the disease are:
- disruption of the nervous and endocrine systems;
- high intracranial pressure;
- diagnosis of hypoxia at birth and a tendency to bradycardia during pregnancy;
- infectious diseases;
- severe hypothermia;
- large dosages of potent medications or their prolonged use;
- rapid growth of internal organs;
- circulatory disorders in the brain;
- malfunction of the thyroid gland.
Often, a child’s heart rate deviates from the norm after a strong fright, holding his breath for a long time and under the influence of vivid emotions and events experienced during the day. These phenomena are temporary and do not indicate pathology.
Heart diseases in children that can be detected by taking an ECG
Based on the cardiogram indicators, the doctor can determine this or that disease in the child.
Heart rhythm disturbances
In medical practice, this condition is called extrasystole. In this case, the patient periodically feels an increase in heart rate with its subsequent freezing. Extraordinary contraction is caused by impaired conduction of cardiac impulses.
In rare cases of arrhythmia attacks, there is no danger to health. Attention should be paid to regularly recurring disturbances in heart rhythm, accompanied by shortness of breath, pain and other negative symptoms.
Arrhythmia
With this pathology, changes in the periodicity of sinus rhythm occur, while the arrival of cardiac impulses occurs at different frequencies. Arrhythmia is sometimes asymptomatic and does not require special treatment. Only in 30% of cases does this condition cause serious health consequences. On the ECG, arrhythmia is manifested by the following deviations:
- the distance between RR intervals is more than 0.16 sec;
- adjacent RR intervals are marked;
- between cardio intervals from 0.3 to 0.6 sec;
- the difference between successive RR intervals is more than 62%;
- the difference between the maximum and minimum RR interval is 780 ms over a recording time of 5 minutes.
Bradycardia
The disease is a type of arrhythmia, with the patient experiencing a decrease in heart rate to 60 beats/min or lower. Sometimes bradycardia is explained by recording an ECG during sleep. Patients with a heart rate less than 40 beats/min experience dizziness, lethargy, fainting, difficulty breathing and other unpleasant symptoms.
Tachycardia
Unlike bradycardia, this disease is accompanied by an acceleration of the heart rate. Temporary tachycardia can be caused by severe physical exertion, psycho-emotional overload, infectious and viral diseases, accompanied by an increase in body temperature. Depending on the age of the child, the following indicators indicate tachycardia:
- newborns – above 170 beats/min;
- children under one year old – above 160 beats/min;
- children under 2 years old – above 155 beats/min;
- 4-6 years – above 125 beats/min;
- 6-8 years – above 118 beats/min;
- 8-10 years – above 110 beats/min;
- 10-12 years – 100 beats/min;
- 12-15 years – above 95 beats/min.
When an ECG indicating the presence of tachycardia is obtained, a repeat study is often performed to confirm the diagnosis.
Cardiac conduction disorder
Normally, the main part of the heart through which electrical impulses pass that excite the atria and ventricles is the sinus node. If this process is disrupted, the patient feels weak, the child experiences a decrease in motor activity, dizziness, lethargy, and sometimes loss of consciousness.
In any case, after taking an ECG for a child, the result must be shown to the attending doctor, who will make or clarify the diagnosis, prescribe a treatment plan, and set a date for control measures.
Symptoms and manifestations
A cardiogram allows you to detect a sharp deviation of the electrical axis of the heart to the left. But besides it, there are a number of manifestations that may indicate a deviation.
Manifestations on the ECG
An electrocardiogram is a recording of changes in potential differences during the process of excitation and relaxation of the atria and ventricles, caused by the electromotive force of the heart (EMF) from the surface of the human body.
Impulses on the cardiogram are displayed in the form of teeth of various sizes:
positive – P, R, T – directed upward relative to the isoline;
negative – Q, S.
During an ECG, the impulse is placed in three planes:
I – left-right hand;
II – left leg – right hand;
III – left leg – left arm.
With a levogram, the following picture can be observed: RI>RII>RIII, SIII>RIII.
In children
In children, left-sided axis deviation is most often associated with congenital heart defects. The alpha angle can be up to -90°.
When the position of the ventricles changes, the axis deviates by an angle from 0 to -20°. With changes in the atria, the axis deviates to -60°.
Clinical manifestations
Axis deviation in itself has no manifestations. Since it is one of the symptoms of other diseases, symptoms may vary.
With coronary heart disease, pressing pain appears behind the sternum. It intensifies with stress or physical activity and goes away in a calm state.
Heart defects of varying degrees may be accompanied by shortness of breath, swelling, and the appearance of a wet cough when lying on the back. If the defect is mild, there may be no symptoms at all, and EOS declines gradually.
With hypertension, the patient has increased blood pressure, which is accompanied by headaches and weakness.
What should its normal position be?
The anatomical structure of the heart is such that its left ventricle weighs more than the right. Therefore, the electrical excitation on the left side of the organ is stronger.
Graphically, this is expressed in the fact that the axis is directed diagonally to the left and down. If you look at the vector projection, the left side of the heart is located in the area from +30 to +70 degrees. This is the normal value for an adult.
The position of the axis also depends on the individual characteristics of physiology.
The direction of EOS is influenced by the following factors:
- Pulse speed.
- The ability of the heart muscle to contract.
- Features of the structure of the spine, chest, internal organs that interact with the heart.
Taking these factors into account, the normal axis value ranges from 0 to +90 degrees.
In a healthy person, the EOS can be in one of the following positions:
- Normal - the angle of deviation from the coordinate axis is from +30 to +70 degrees.
- Intermediate - from +15 to +60.
- Vertical - between +70 and +90. This is typical for thin people with a narrow chest.
- Horizontal - from 0 to + 30 degrees. It occurs in people with a wide chest and short stature.
In newborns, deviation of the EOS to the right is often observed. By one or two years, she moves to a vertical position. After children reach the age of three, the axis usually returns to its normal position.
This is due to the growth of the heart, in particular, with an increase in the mass of the left ventricle.
Reasons for shift to the left
The reasons for the displacement of the EOS to the left side can be caused by both heart disease and physiological conditions.
Heart diseases
The reasons for a pronounced deviation of the electrical axis to the left can be:
- Increased pressure in blood vessels. Occurs due to disruption of the kidneys or hormonal system, as well as hypertension.
- Heart defects of various nature. Improper functioning of the valves leads to stagnation of blood in the ventricles, between the atria or in the vessels. As a result, the chambers enlarge and muscle growth begins.
- Cardiac ischemia. Due to insufficient blood flow in the heart muscle, the connective fibers in the walls increase. The organ becomes heavier and deviates.
- Cardiomyopathy. In this disease, the heart chambers and muscle walls become enlarged due to structural abnormalities.
- Myocarditis. The walls of the heart become inflamed. Not all doctors can diagnose the disease. To identify it, a special study is required.
- Myocardial infarction localized in the left ventricle.
Physiological conditions
If the EOS is slightly deviated, this can be considered a variant of the norm. This deviation can occur in athletes, as well as in people with an asthenic body type.
Axis shifts can be associated with deep inhalation and exhalation, when the diaphragm greatly expands and contracts, resulting in pressure on the internal organs. In a horizontal position, the axis also tilts to the left.
In what cases is EOS deviated in children?
In newborns, the deviation of the electrical axis of the heart to the right is considered normal. This is due to the fact that the right ventricle in childhood is heavier than the left. In the second year of life, the EOS begins to level out. And by the age of six, the heart occupies the correct position in the chest.
Normal values and causes of violation
The direction of this indicator depends on various physiological and anatomical factors.
The average norm is considered to be 590. But variants of the normogram fall into a wide range from 200 to 1000. In a state of health, the electrical axis shifts to the left under the following conditions:
- at the moment of deep exhalation;
- when the body position changes to horizontal, the internal organs put pressure on the diaphragm;
- with a high-standing diaphragm - observed in hypersthenics (short, strong people).
A shift of the indicator to the right in the absence of pathology is observed in the following situations:
- at the end of a deep breath;
- when changing body position to vertical;
- For asthenics (tall, thin people), the norm is the vertical position of the EOS.
The location of the electrical axis is determined by the fact that the mass of the left ventricle under normal conditions is greater than the mass of the right half of the heart muscle. Due to this, electrical processes occur more intensely in it, so the vector is directed towards it.
The direction of this indicator depends on various physiological and anatomical factors. The average norm is considered to be 59 0. But the normogram options fall in a wide range from 20 0 to 100 0.
Diagnostics
Deviation of the heart axis to the left is diagnosed first of all by performing an electrocardiogram. A cardiologist determines the angle of deviation in several ways.
Visual definition
Visual comparison of the R and S waves is a simple and clear way. However, it does not detect deviation accurately. When the EOS deviates to the left, you can see a picture of RI - SIII on the cardiogram, which means the R-type of the ventricular complex in the first lead and the S-type in the third.
Alpha angle offset detection
Calculating the alpha angle allows you to accurately determine the degree of deviation. Diagnostic doctors find the algebraic sum of the teeth in the first and third standard leads. They calculate the height of the teeth in mm, then add the resulting values. The final result is substituted into the table according to Diede and the alpha angle is calculated.
Sinus rhythm on ECG
Sinus rhythm characterizes oscillations that arise from impulses in a certain node and diverge through the atrium and ventricle. As a result, the heart muscle contracts. Sinus rhythm disturbances indicate arrhythmia or blockade.
The importance of the cardiac conduction system for determining EOS
The conduction system of the heart is necessary for the autonomous generation of electrical impulses and their distribution to all parts of the muscle. However, if the left ventricle is enlarged, it takes longer for electrical impulses to reach it. Consequently, the normal ventricle depolarizes much earlier than the hypertrophied ventricle, which remains electropositive. Due to this, a powerful vector is formed directed towards the hypertrophied ventricle, and the electrical axis of the heart is deviated towards the hypertrophied ventricle.
How is offset determined?
The position of this axis is determined by electrocardiography, after analyzing an electrocardiogram from several leads.
To detect changes in the normal location of the axis, 2 methods can be used.
This technique is most often used by diagnosticians. Normally, the EOS completely coincides with the anatomical axis (the heart is located semi-vertically, and the lower end deviates down and slightly to the left). Its location is determined by the alpha angle formed from 2 straight lines (1 abduction axis and the EOS vector line).
To identify the angle, the sum of the S, R and Q waves in 3 and 1 standard leads is calculated. The positive and negative value of each tooth must be taken into account.
Diede's table is then used. Having entered the result, the doctor determines the criteria for the alpha angle.
Click on the picture to enlarge
Normally, this angle should be from – 29° to 89°. Significant (pronounced) left-sided displacement of the axis is a sign of pathological disorders. When it changes to – 30°, we are talking about a left-sided deviation, and when it changes from 90° to 180°, it’s a right-sided deviation.
A left-side deviation of the angle from – 30° to – 44° is considered small (insignificant), but if it is shifted from – 45° to – 90°, this is considered significant and in most cases accompanies cardiac pathologies.
This technique for determining the displacement of the heart axis is most often used by therapists and cardiologists. After an ECG, the doctor compares the magnitude of the S and R waves in leads 1 and 3. If within one of them the value of R is greater than S, we are talking about a ventricular complex (R-type). Otherwise, the complex belongs to the S-type.
When the axis deviates to the left, tooth RI - SIII. This means that the ventricular complex is R-type in lead 1, and S-type in lead 3.
Standard lead of QRS waves in different positions of the EOS (a, b – right-sided displacement; c – normal position of the axis; d, e – left-sided displacement)
The main tool for determining deviations of the EOS to the left is electrocardiography, in which this can be seen visually, however, a number of auxiliary studies are necessary to confirm the result.
Additional diagnostic methods - a set of examinations
Based on the indications of axis deviation to the left, it is impossible to reliably determine what changes are occurring in the heart muscle. Therefore, cardiologists prescribe a number of additional examinations.
- Ultrasound. Allows you to determine how enlarged the ventricles are and how their contractile function is impaired.
- Electrocardiogram with exercise (walking on a treadmill or riding an exercise bike). Allows you to detect coronary heart disease.
- Chest X-ray. If the tissue is significantly enlarged, the shadow of the heart will be larger.
- 24-hour Holter ECG monitoring. Performed in case of significant cardiac dysfunction src=”https://infoserdce.com/wp-content/uploads/2021/08/foto-7.jpg” class=”aligncenter” width=”375″ height=”510″[ /img]
- KAG. Also necessary for diagnosing coronary artery disease.
- Echocardioscopy. Allows you to fully assess the condition of all components of the heart muscle.
Treatment
Since deviation of the EOS to the left is not a disease, it is necessary to understand the reasons for its occurrence. And only after a thorough diagnosis, doctors prescribe treatment for the identified disease.
Coronary heart disease, cardiopathy and heart failure are treated with medications. In addition, you need to follow a diet and daily routine, avoid stress and give up bad habits.
Congenital and acquired heart defects often require surgical intervention. In particularly difficult cases, a pacemaker is installed. The device sends signals to the heart muscle, thereby causing it to contract.
If the axis deviation occurs abruptly, the patient may have a heart attack. This condition requires urgent hospitalization and threatens cardiac arrest.
If EOS deviation is asymptomatic, there is no need to worry. However, it is necessary to constantly monitor the work of the heart and do an ECG at least once a year. Such prevention will make it possible to identify serious diseases in time and begin their treatment.
Features in children
If a child develops a clinical picture characteristic of the development of heart failure, an examination should be started in a timely manner. Symptoms suggesting deviation of the EOS to the left include:
- rapid fatigue when screaming, active turns or other movements in a newborn,
- formation of edema of dense consistency,
- increased breathing, especially during exercise,
- lag in weight gain and growth deficiency - this symptom is clearly noticeable in adolescence and early childhood.
The most common causes of axis deviation are congenital defects - the ductus ductus, patent septum, or narrowing of the junction of the right ventricle and the pulmonary artery. With their timely treatment, negative consequences can be avoided. However, if a small patient has already developed a pronounced deviation of the EOS to the left, the changes in the heart are most likely irreversible.
- Characteristics of the vertical position of the EOS and its consequences
In this case, after correcting the defect, the necessary therapy is determined and a number of working conditions are excluded, including military service.
Possible consequences and complications
The main threat to the body is not the deviation of the axis to the left, but the diseases that accompany it. Enlargement of the left ventricle can cause the following consequences:
- severe heart failure;
- angina pectoris;
- arrhythmia;
- death due to cardiac arrest.
All these consequences are interconnected and follow from one another. Therefore, if the ECG revealed a deviation of the heart axis to the left, it is necessary to undergo additional examinations. They will allow you to identify the true cause of the changes and prescribe the necessary treatment in time.
Signs of displacement on the ECG
The angle of the electrical axis and its direction are the main characteristics when deciphering the ECG.
The interpretation of the cardiogram is given by a cardiologist. To do this, he uses special diagrams and tables designed to determine the displacement of the EOS.
The diagnostician examines the QRS waves on the electrocardiogram. This is a set of symbols that shows the sinus rhythm of the heart and displays the polarization of the ventricles.
QRS waves characterize their contraction or relaxation. R – tooth directed upward (positive), Q, S – negative, or directed downward. Q is before R and S is after it. Based on these signs, the cardiologist judges how the axis is shifting.
Deviation of the electrical axis of the heart to the right occurs if R is greater in the third lead than in the first. If the highest R amplitude is in the second lead, the EOS corresponds to the normal position.
Diseases accompanied by levogram
Most patients are trying to understand what it means when the electrical axis of the heart is deviated to the left and what diseases this is associated with. The most common cause is hypertension. When blood pressure is constantly elevated, the load on the left chambers of the heart muscle increases. Which leads to an enlargement of the ventricle and atrium. Accordingly, the electrical axis of the heart shifts to the left.
Acquired heart defects associated with the appearance of atherosclerotic plaques also lead to an increase in the hemodynamic load on the left ventricle. This occurs due to damage to the aortic and mitral valve.
Myocarditis leads to inflammation of the walls of the heart muscle. Accordingly, the tissues increase in volume and hypertrophy occurs. The disease can only be determined in special cardiology centers by undergoing a scintigraphic examination.
Author of the article: Yulia Dmitrieva (Sych) - In 2014, she graduated with honors from Saratov State Medical University named after V. I. Razumovsky. Currently working as a cardiologist at the 8th City Clinical Hospital in the 1st clinic.
Effect of direction of ventricular depolarization
It can be confirmed in case of incomplete blockade of the anterior branch of the left ventricle, when the propagation of impulses along the upper left parts of the left ventricle is impaired and the average electrical axis of the QRS complex is deviated to the left (see section “Impaired intraventricular conduction”). On the contrary, with pancreatic hypertrophy it is deviated to the right.