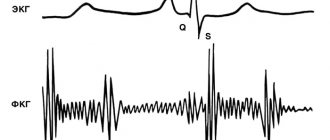
Brief description of ECG elements
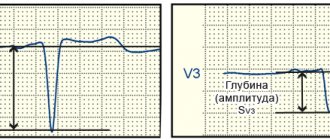
In the graphic image, time is recorded horizontally, and frequency and depth of changes are recorded vertically. Sharp angles displayed above (positive) and below (negative) from the horizontal line are called serrations. Each of them is an indicator of the condition of one or another part of the heart.
On the cardiogram, the waves are designated as P, Q, R, S, T, U.
- the T wave on the ECG reflects the recovery phase of the muscle tissue of the heart ventricles between myocardial contractions;
- wave P – indicator of depolarization (excitation) of the atria;
- teeth Q, R, S reflect the excited state of the ventricles of the heart;
- The U-wave determines the recovery cycle of distant areas of the cardiac ventricles.
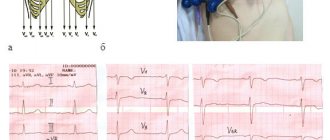
The range between adjacent teeth is called a segment; there are three of them: ST, QRST, TP. The tooth and the segment together represent the interval - the time it takes for the impulse to pass. For accurate diagnosis, the difference in indicators of the electrodes (electric potential of the lead) attached to the patient’s body is analyzed. Leads are divided into the following groups:
- standard. I – difference in indicators on the left and right hand, II – ratio of potentials on the right hand and left leg, III – left hand and leg;
- reinforced. AVR – from the right hand, AVL – from the left hand, AVF – from the left leg;
- chest Six leads (V1, V2, V3, V4, V5, V6) located on the chest of the subject, between the ribs.
A qualified cardiologist deciphers the results of the study.
Having received a schematic picture of the work of the heart, the cardiologist analyzes the changes in all indicators, as well as the time for which the cardiogram records them. The main data for decoding are the regularity of muscle contractions of the heart, the number (number) of heart contractions, the width and shape of the waves reflecting the excited state of the heart (Q, R, S), the characteristics of the P wave, the parameters of the T wave and segments.
T wave indicators
Repolarization or restoration of muscle tissue after contractions, which is reflected by the T wave, has the following standards in the graphic image:
- lack of serration;
- smoothness on the rise;
- upward direction (positive value) in leads I, II, V4–V6;
- strengthening the range values from the first to the third lead to 6–8 cells along the graphic axis;
- downward (negative value) in AVR;
- duration from 0.16 to 0.24 seconds;
- predominance in height in the first lead in relation to the third, as well as in lead V6 compared to lead V1.
Deviation of the pattern from the norm indicates dysfunction of the ventricles of the heart after muscle contraction.
Early ventricular repolarization syndrome
One form of these disorders is early ventricular repolarization syndrome (EVRS), an ECG variant observed in 2-5% of the population, more common in men, young adults, adolescents and athletes. Not so long ago it was thought that this syndrome has a completely favorable prognosis, that is, it does not affect a person’s health and life in any way. However, it was later discovered that some forms of it increase the risk of developing dangerous arrhythmias and cardiac arrest. This risk can be assessed using an ECG.
T wave changes
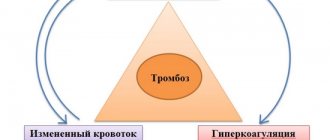
The transformation of the T wave on the electrocardiogram is due to changes in the functioning of the heart. Most often they are associated with impaired blood supply resulting from damage to blood vessels by atherosclerotic growths, otherwise known as coronary heart disease.
Deviation from the norm of lines reflecting inflammatory processes can vary in height and width. The main deviations are characterized by the following configurations.
An inverted (inverse) form indicates myocardial ischemia, a state of extreme nervous excitement, cerebral hemorrhage, and an increase in heart rate above (tachycardia). Leveled T manifests itself in alcoholism, diabetes, low potassium concentration (hypokalemia), cardiac neurosis (neurocircular dystonia), and abuse of antidepressants.
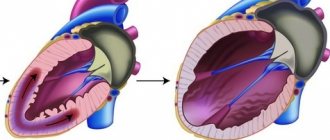
A high T-wave, displayed in the third, fourth and fifth leads, is associated with an increase in the volume of the walls of the left ventricle (left ventricular hypertrophy), pathologies of the autonomic nervous system. A slight rise in the pattern does not pose a serious danger; most often, it is associated with irrational physical activity. Biphasic T indicates excessive consumption of cardiac glycosides or left ventricular hypertrophy.
The wave shown below (negative) is an indicator of the development of ischemia or the presence of severe excitement. If a change in the ST segment is observed, the clinical form of ischemia – infarction – should be suspected. Changes in wave pattern without involvement of the adjacent ST segment are not specific. Determining a specific disease in this case is extremely difficult.
There are a significant number of etiological factors for changes in the T wave in pathology of the heart muscle
Causes of repolarization disorders
The repolarization process can be influenced by many factors, including:
- Diseases of the myocardium itself (for example, myocarditis, ischemia, infarction, infiltrative process).
- Medicines (eg digoxin, quinidine, tricyclic antidepressants and many other drugs).
- Electrolyte disturbances in the concentration of potassium, magnesium and calcium.
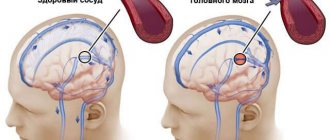
- Neurogenic factors (for example, ischemic or hemorrhagic stroke, traumatic brain injury, brain tumor).
- Metabolic factors (eg, hypoglycemia, hyperventilation).
- Disturbances in the conduction of electrical signals in the ventricles.
- Pathological rhythm, the source of which is in the ventricles.
Secondary abnormalities in myocardial repolarization are normal ST segment and T wave changes that develop solely due to changes in the ventricular firing sequence. Such changes are most often focal in nature, that is, they are observed only in part of the ECG leads. These include:
- Changes characteristic of His bundle block.
- Changes that occur in Wolff-Parkinson-White syndrome.
- Changes characteristic of premature ventricular contractions, ventricular arrhythmias and ventricular rhythm.
Primary disturbances of repolarization processes are changes in the ECG that do not depend on uncoordinated ventricular activation, but may be the result of a diffuse or focal pathological process affecting ventricular relaxation. These include:
- Effect of drugs (for example, digoxin or quinidine).
- Electrolyte disturbances (eg, hypokalemia).
- Ischemia, heart attack, inflammation (myocarditis).
- Neurogenic factors (for example, subarachnoid hemorrhage can cause prolongation of the QT interval).
Causes of a negative T-wave
If, with a negative T wave value, additional factors are involved in the process, this is an independent heart disease. When there are no concomitant manifestations on the ECG, a negative T display may be due to the following factors:
- pulmonary pathologies (difficulty breathing);
- disruptions in the hormonal system (hormone levels are higher or lower than normal);
- cerebrovascular accident;
- overdose of antidepressants, heart medications and drugs;
- a symptomatic complex of disorders of part of the nervous system (VSD);
- dysfunction of the heart muscle not associated with coronary disease (cardiomyopathy);
- inflammation of the heart sac (pericarditis);
- inflammatory process in the inner lining of the heart (endocarditis);
- mitral valve lesions;
- enlargement of the right side of the heart as a result of hypertension (cor pulmonale).
Objective ECG data regarding changes in the T wave can be obtained by comparing a cardiogram taken at rest and an ECG in dynamics, as well as the results of laboratory tests.
Since abnormal T-wave display may indicate CAD (ischemia), regular electrocardiography should not be neglected. Regular visits to a cardiologist and an ECG procedure will help identify pathology at the initial stage, which will significantly simplify the treatment process.
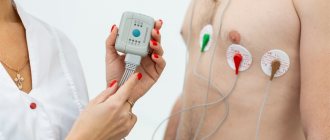
Possibilities of Holter monitoring in detecting myocardial ischemia.
Akselrod A.S., Head of the Department of Functional Diagnostics
To the Cardiology Clinic of MMA named after. THEM. Sechenov
Today, the screening method for detecting myocardial ischemia is still the stress ECG test. However, one can find conflicting publications about the capabilities of Holter monitoring in the diagnosis of coronary artery disease, with most authors pointing to the low (from 10 to 50%) sensitivity of this method. Therefore, discussion of the place of Holter monitoring in the algorithm for verifying coronary artery disease seems to be a relevant topic in practical cardiology.
Advantages and disadvantages of Holter monitoring compared to stress testing.
In the publications mentioned above, most authors use two- and three-channel 24-hour ECG recorders. Of course, the sensitivity of the method will be much higher when using a twelve-channel recorder, although, of course, none of the Holter recorders can replace the stress test as a screening method.
These two research methods have one thing in common: ECG dynamics over time. In all other respects they are fundamentally different. At the same time, Holter monitoring has three fundamental disadvantages compared to stress testing:
- during Holter monitoring, the patient himself chooses the load mode, so submaximal heart rate is often not achieved;
- the load is not of a continuously increasing nature;
- the loading regime cannot be immediately controlled by a doctor (only retrospective analysis is possible).
However, Holter monitoring has a number of advantages in detecting myocardial ischemia both compared to standard resting ECG and compared to stress tests. These benefits include:
- the possibility of natural modeling (by collecting anamnesis, you can simulate almost any situation typical for a patient that provokes an ischemic attack);
- the ability to establish a clear cause-and-effect relationship between the attack and the conditions of its occurrence (the diary is used to compare the patient’s activity with the time of the onset and end of the ischemic episode);
- detection of silent myocardial ischemia, especially at night;
- assessment of the effectiveness of antianginal therapy depending on the time of day and the possibility of more precise therapeutic correction taking into account other changes (for example, rhythm disturbances and cardiac conduction).
Myocardial ischemia is a situation of insufficient blood supply to the myocardium with two different outcomes: subsequent restoration of metabolism in cardiomyocytes (a disturbance in the repolarization process occurs and the dynamics of the T wave is recorded) or the progressive development of damage to muscle fibers (manifested by certain forms of ST segment displacement above or below the isoline). With further deterioration of the blood supply to the heart, irreversible damage to a larger number of myocardiocytes occurs, the development of inflammation and necrosis. In this case, pronounced dynamics of the ST segment and a change in the QRS complex are noted.
During Holter monitoring, you can clearly see the first two outcomes of coronary insufficiency, which will be discussed in this lecture.