What is RDW?
Erythrocytes are red, biconcave, disc-shaped bodies that color the blood accordingly. They form the basis of blood and supply oxygen to tissues and organs. In healthy people they do not differ in volume, color and shape. The proper functioning of red blood cells does not depend on their diameter, but rather on their volume. Its average is designated MCV. In healthy people, this value may vary within small limits. In medicine, this range is called erythrocyte heterogeneity, or volume distribution width. Typically, red cells decrease in volume as a person ages, so there is a difference between them. In addition, it may be associated with anemia or malignant tumors. The appearance of red blood cells of different volumes in the blood is called anisocytosis. In order to determine changes, the doctor orders a blood test for RDW.
Distribution of red blood cell volume (RDW) in newborns: preliminary data
- Karpova Anna Lvovna
- Karpov Nikolay Yurievich
- Mostovoy Alexey Valerievich
- Nadezhda Alekseevna Kucherova
- Yolanta Antanasovna Kropf
Summary
The indicator of distribution of erythrocytes by volume -
Red Blood Cell Distribution Width ( RDW) - reflects the heterogeneity of the volume of red blood cells and, being essentially an integral indicator, represents a quantitative assessment of anisocytosis.
Many diseases are accompanied by significant changes in the size and volume of red blood cells, so RDW is currently considered in the medical literature as a universal marker and precursor of most diseases. RDW manifests itself not only as an indicator used in the laboratory assessment of anemia, but also as a marker of inflammation, oncopathology, diseases of the gastrointestinal tract and cardiovascular system. However, the number of studies in neonates evaluating the diagnostic and prognostic value of RDW is extremely limited. The purpose of the study
was to determine the normative values of RDW in full-term newborns in the early neonatal period and to evaluate its diagnostic value.
Materials and methods.
The study is retrospective.
In total, the medical records of 75 full-term newborns were analyzed. The children were divided into 2 groups. The 1st group included healthy newborns - 52 children, the 2nd group - children who had laboratory criteria for an infectious process from the first day of life - 23 children. Peripheral blood was collected for clinical analysis at the age of 1-2 days of life. Results.
The average RDW value in healthy full-term newborns in our study was 13.92%.
In newborns with laboratory criteria for an infectious process, RDW was statistically significantly higher than in healthy children and corresponded to 16.35% (p <0.001). There were no statistically significant differences between the compared groups in the average values of the main indicators of red blood, and no statistically significant correlation between RDW and the number of red blood cells and hematocrit level was found. Conclusions.
RDW can be used in newborns as a marker of infectious process.
However, the clinical significance of this criterion in newborns, in particular with infectious pathology, should be the subject of further research. Key words: newborns, red blood cells, distribution of red blood cell volume.
Neonatology: news, opinions, training. 2014. No. 1. P. 107-111.
RDW (red blood cell distribution width) represents a parameter of a standard complete blood count that reflects the width of the distribution of red blood cells (red blood cell volume distribution width or red blood cell volume distribution width). Essentially, RDW is a quantitative measure of the difference in red blood cell volume (anisocytosis) or an index of red blood cell heterogeneity. The higher the score, the greater the difference in the size of red blood cells. Most often, this criterion is used to differentiate anemia of mixed origin from anemia due to a single etiological factor. A similar function is performed by the Price-Jones curve, which is extremely tedious to calculate manually. This indicator is determined by most hematological analyzers as the coefficient of variation of the average volume of erythrocytes: RDW=SD/MCV×100%, where SD is the standard deviation of the volume of erythrocytes from the mean value, and MCV is the average volume of erythrocytes [9].
Many diseases are accompanied by significant changes in the size and volume of red blood cells, so RDW is currently considered in the medical literature as a universal marker and harbinger of all diseases. Thus, in a study by O. Harmanci et al. (2012) found that RDW in septic shock is a significant prognostic criterion for mortality. Its increase to 19.4% on the first day of septic shock was a significant predictor of an unfavorable outcome [6]. In the work of CS Song et al. (2012) showed that RDW represents an additional and cost-effective indicator of inflammation, as it was directly correlated with inflammatory markers and inversely correlated with stem cell factors [9]. In a study by M. Montagnana et al. (2012) demonstrated that RDW is the most significant indicator of non-anemic activity of intestinal inflammation (area under the curve for Crohn's disease, 0.852, p
<0.001;
area under the arc under the curve in ulcerative colitis, 0.827, p
< 0.001). The authors concluded that there is a clear association between increased distribution of red blood cells in the blood and disease manifestations in patients with inflammatory bowel disease with and without anemia [7]. Inflammation plays a major role in the pathogenesis and progression of Alzheimer's disease. A study by Z. Forhecz (2012) assessed the relationship between RDW and Alzheimer's disease. RDW levels were significantly increased in patients with Alzheimer's disease [5].
The predictive value of RDW for mortality in cardiovascular diseases in adults has also been widely discussed. Thus, in a study by F. Seretisa et al. (2011), which included 6159 outpatients with chronic heart failure, showed that RDW >16% at baseline was associated with greater mortality than those with RDW ≥16% [4].
RDW can be used as a surrogate marker of atrophy in patients with iron deficiency and presumed celiac disease. In addition, the sensitivity, specificity, negative and positive predictive scores of RDW are increased when it is used in combination with high levels of transglutaminase IgA antibodies [8].
In the work of B. Cakal et al. (2009) indicate that RDW may become a new biomarker of breast cancer manifestation. Two age-matched groups of patients with benign and malignant lesions of the mammary glands were studied. RDW was significantly higher in fibroadenoma patients with larger tumors, a higher number of axillary lymph nodes with infiltrates, and overproduction of HER2 protein [3].
In light of the above, it is very important to note that the main advantages of the marker under discussion are its ease of measurement, low cost of the study and the absence of additional invasiveness. The latter becomes particularly relevant in the context of neonatal practice. Unfortunately, there are very few studies in newborns on the diagnostic and prognostic value of RDW.
Purpose of the study
To determine the normative values of RDW in full-term newborns in the early neonatal period and evaluate its diagnostic value.
Materials and methods
The study is retrospective. All children were born in maternity hospital No. 9 in St. Petersburg in 2012-2013. In total, the medical records of 75 full-term newborns were analyzed. The children were divided into 2 groups. The 1st group included healthy newborns - 52 children, the 2nd group - children who had laboratory criteria confirming the presence of an infectious process from the first day of life - 23 children. The general inclusion criteria for all newborns were gestational age 38-40 weeks, body weight not less than 2800 and not more than 4000 g, height - 48-52 cm, vaginal delivery without surgical aid. For healthy children, additional inclusion criteria were: the absence of a long anhydrous interval (more than 18 hours) and a history of chorioamnionitis, clear amniotic fluid, an Apgar score at the end of the 1st and 5th minutes of at least 8 points, the absence of any diagnosis in early neonatal period, discharge home with vaccination against tuberculosis. Additional criteria for including children in the 2nd group were: the presence of a long anhydrous interval (more than 18 hours) and a history of chorioamnionitis, an Apgar score at the end of 1 minute of at least 7 points, a condition from the first day of life of moderate severity and the absence the need for transfer to the neonatal intensive care unit, the presence of laboratory criteria for an infectious process from the first day of life (leukocytosis more than 30.00 × 10⁹/l, neutrophil ratio more than 0.20-0.22 [11], an increase in CRP by the end of the first day of life more 6 mg/dl). Exclusion criteria: severe condition and the presence of congenital malformations. Peripheral blood was collected for clinical analysis at the age of 1-2 days of life.
Statistical processing of the data was carried out using the software package STATISTICA v. 6.0. All variation series were analyzed in relation to the nature of the distribution using the Shapiro-Wilk test. When assessing quantitative indicators, the median was calculated ( Me
), 95% confidence interval (95% CI), percentiles, means (
M
), minimum and maximum values of the trait, and standard deviation (
SD
).
For dichotomous indicators, the absolute number (sum) and percentage of the characteristic (proportion) were determined. t
was used for comparison ; in other cases, the Mann-Whitney test was used.
Dichotomous comparisons were made using Fisher's exact test. To assess the relationship between individual indicators, the Spearman rank correlation test was used. Differences in indicators were considered statistically significant at the p
<0.05 level.
results
Analysis of anamnestic data did not reveal significant differences between the groups in extragenital pathology and obstetric-gynecological history in the mothers of the examined children (Table 1).
Some features of the course of pregnancy and childbirth are presented in Table. 2.
According to those presented in table. According to data from Table 2, there were practically no significant differences between the groups in terms of the characteristics of the course of pregnancy, with the exception of toxicosis of the 1st half, which was statistically significantly more common in the first group. Among the main features of the course of labor, it should be noted that in every third case in the 2nd group there were green waters.
The main clinical characteristics of the children included in the study are presented in Table. 3.
As can be seen from table. 3, the newborns included in the study were comparable in terms of basic clinical characteristics, including gender. In group 2, a slightly lower Apgar score was recorded, but these differences were not statistically significant.
The average RDW values in both groups are presented in Table. 4. The average RDW value in healthy full-term newborns in our study corresponded to 13.92%. In newborns with laboratory criteria for an infectious process, RDW was statistically significantly higher and corresponded to 16.35% ( p
<0.001). We performed a percentile distribution of RDW, the results are presented in table. 5.
In addition, we assessed the frequency of occurrence of a trait (RDW indicator) that differs from the mean by 1 and 2 standard deviations ( SD
). It turned out that the number of deviations from the average normative value was statistically significantly more often observed in the group of children with laboratory criteria for an infectious process (Table 6).
In order to assess the relationship between RDW and red blood parameters, we performed a comparative analysis of the average values of the number of red blood cells, hemoglobin levels and peripheral hematocrit (Table 7), as well as Spearman correlation analysis (Table 8).
There were no statistically significant differences between the compared groups in the average values of the main red blood parameters. The number of red blood cells, hemoglobin levels and peripheral hematocrit did not exceed the age norm [1, 2].
As a result of correlation analysis, we did not find a statistically significant linear relationship between RDW and red blood parameters.
Discussion
The average values of the erythrocyte distribution by volume (RDW) in healthy full-term newborns (13.92%) obtained in our study turned out to be comparable to the normative level of the indicator under discussion typical for adults, which is, according to CS Song et al. (2012), 11.5-14.5% [9]. However, at the same time, our results are not entirely consistent with the results of one of the few studies that discuss the diagnostic value of this marker in newborns. In a study by A. Tonbul et al. (2011) demonstrated the dependence of RDW in newborns on gestational age at the time of birth. In total, 1594 children were examined. According to the authors, RDW values varied depending on gestational age and were respectively ( M±SD
): <30 weeks - 17.67±2.283; 31-32 weeks - 16.9±1.98; 32-34 weeks - 17.86±2.23; 35-36 weeks - 16.81±1.82; 37-42 weeks - 16.65±1.81 [10].
The lack of dependence of RDW on the number of red blood cells and the level of peripheral hematocrit in newborns, in our opinion, can be regarded as a sign that this particular marker is more sensitive and begins to change much earlier than other indicators of red blood in response to the influence of pathological factors, indicating primarily on bone marrow irritation. This circumstance suggests that RDW in newborns may have some prognostic value, but this issue requires further research.
conclusions
RDW can be used in newborns as a marker of infectious process. The sensitivity and specificity of this diagnostic criterion, as well as its positive and negative predictive value, should be the subject of further research, with greater research focus on elucidating the diagnostic and prognostic value of RDW in relation to the development of neonatal sepsis.
Literature
1. Neonatology: National guidelines. - M.: GEOTARMEDIA, 2007. - 847 p.
2. Shabalov N.P.
Neonatology. — 5th ed., rev. and additional: In 2 vols. - M.: MEDpress-inform, 2009. - 1504 p.
3. Cakal B., Gokmen A.A., Ustundag Y.
Red Cell Distribution Width for Assessment of Activity of Inflammatory Bowel Disease // Dig. Dis. Sci. - 2009. - Vol. 54. - P. 842-847.
4. Cauthen CA, Tong .W., Jain A., Tang WHW
Progressive Rise in Red Cell Distribution Width Is Associated with Disease Progression in Ambulatory Patients with Chronic Heart Failure // J. Card. Fail. - 2012. - Vol. 18, N 2. - P. 146-152.
5. Forhecz Z., Gombos T., Borgulya G., Pozsonyi MZ
Red cell distribution width in heart failure: Prediction of clinical events and relationship with markers of ineffective erythropoiesis, inflammation, renal function, and nutritional state. Budapest//Am. Heart J. - 2009. - Vol. 158, N 4. - P. 659-666.
6. Harmanci O., Kav T., Sivri B.
Red Cell Distribution Width Can Predict Intestinal Atrophy in Selected Patients with Celiac Disease Ankara Department of Gastroenterology // J. Clin. Lab. Anal. - 2012. - Vol. 26. - P. 497-502.
7. Montagnana M., Cervellin G., Meschi T., Lippi G.
The role of red blood cell distribution width in cardiovascular and thrombotic disorders // Clin. Chem. Lab. Med. - 2012. - Vol. 50, N 4. - P. 635-641.
8. Seretisa F., Lagoudianakisa E., Gemenetzisa G., Salemisa NS
Is Red Cell Distribution Width a Novel Biomarker of Breast Cancer Activity? Data from a Pilot Study of Charalampos Seretisa // J. Clin. Med. Res. — 2013. — Vol. 5, N 2. - P. 121-126.
9. Song CS, Park D, Yoon MY et al.
Association between Red Cell Distribution Width and Disease Activity in Patients with Inflammatory Bowel Disease // Dig. Dis. Sci. - 2012. - Vol. 57. - P. 1033-1038.
10. Tonbul A., Tayman C., Catal F. et al.
Red Cell Distribution Width (RDW) in the Newborn: Normative Data // J. Clin. Lab. Anal. - 2011. - Vol. 25. - P. 422-425.
11. Weinberg GA et al.
Laboratory aids for diagnosis of neonatal sepsis // Infectious Diseases of the Fetus and Newborn Infants. 6th ed. /Ed. JS Remington. - Philadelphia: Saunders, 2006. - R. 1210.
How is the research going?
Modern analyzers allow you to quickly and with high quality carry out blood tests, assess the condition of red blood cells during treatment, and decide on further therapy. They count the number of red blood cells of different sizes per 1 μl of blood. Analyzers calculate the average volume of the red cell and determine the degree of deviation from the normal value of this parameter. The result is displayed in the form of a histogram.
The test may give a false positive result. This is due to the fact that there are many modified red blood cells in the blood called macrocytes. For greater reliability, the Price-Jones curve is examined.
The most accurate analysis result for RDW SD (standard deviation) and RDW CV (coefficient of variation) is obtained by manual calculation, but this method is very labor-intensive and time-consuming, so it is practically not used at present.
Blood for RDW is taken from a vein in the elbow
If all indicators are normal, the result is negative. If the RDW is elevated, the result is considered positive. Typically, in this case, a re-examination is required to determine the exact cause of the increase, since after one blood draw the diagnosis cannot be considered final. The fact is that RDW can be elevated immediately after a blood transfusion or surgery. In any case, if a positive result is obtained, a repeat blood donation is required, followed by a histogram examination. The distribution and modification of red blood cells can change quickly and frequently.
Reduced RDW: norm and pathology
A person in good health has red blood cells of the same shape, density and color. In case of deviation, especially in the presence of autoimmune diseases or oncology, the failure occurs at the level of microcells, when young cells do not receive a certain number of components, which, in fact, inhibits their performance. Thus, anemia occurs - a pathology during which the body does not receive the required amount of oxygen, in other words, the metabolic function in red blood cells is disrupted.
Analysis transcript
The RDW norm is 11.5-14.5% for adults, regardless of age, 14.9-18.7% for children under six months, 11.6-14.8% for children over six months. If the value is less than or exceeds the norm, it is necessary to be examined for diseases and undergo treatment.
In children and adults, RDW is increased with anemia (iron deficiency, hemolytic, megaloblastic), vitamin B12 and folate deficiency, and liver diseases.
An RDW level below normal levels may indicate the development of various types of anemia.
When interpreting the analysis, MCV values are taken into account. This helps in diagnosis to distinguish between different types of microcytic anemias. If RDW is normal and MCV is low, this may indicate diseases such as:
- blood transfusion;
- thalassemia;
- hemorrhage;
- post-traumatic splenectomy;
- malignant tumors and a course of chemotherapy.
If, with a decreased MCV, the RDW indicator is increased, this may indicate beta thalassemia, iron deficiency, and erythrocyte fragmentation. With increased MCV and normal RDW, we can talk about liver disease.
If both indicators are high, then there is a possibility of vitamin B12 deficiency, hemolytic anemia, and cold agglutination. In addition, this result is observed during chemotherapy.
Video about the method of collecting blood from a vein for RDW research:
Causes
So, the erythrocyte distribution index is reduced - what does this mean? There are several reasons that can reduce the RDW indicator:
- Acute blood loss due to injuries and pathological bleeding.
- Frequent operations.
- A metabolic disorder during which the food consumed is not completely digested.
- Hormonal imbalance, which most often occurs in women.
- Deficiency of B vitamins and iron in the body.
- Blood diseases characterized by rapid destructive processes.
What do the results depend on?
RDW CV and SD values in the absence of health problems should correspond to established standards, which differ depending on the patient’s age and gender.
Any deviations up or down are a sign that pathological processes are occurring in the body or diseases are developing. But it also happens that the examination result turns out to be false positive. The causes of a laboratory error are a person’s failure to follow recommendations regarding proper preparation for blood sampling or incorrect actions of medical personnel.
If the result shows deviations from the norm, the analysis must be repeated to ensure the reliability of the results and eliminate errors.
Water imbalance
Lack of water in the body causes blood volume levels to decrease. In this case, the blood is more viscous and thick. Under such conditions, a clinical blood test will indicate that the level of red blood cells is elevated. Doctors recommend monitoring the water balance in the body and drinking at least 1 liter of clean water per day. This will help prevent an increase in the relative width of the distribution of red blood cells by volume. Even if you are slightly thirsty, you should take a few sips of water. Most often, dehydration occurs due to overheating of the body, an intestinal infection or a burn.
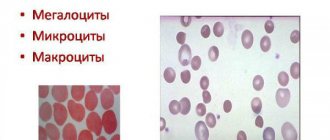
Classification of anisocytosis
There are four degrees:
- first (minor anisocytosis) – microcytes and macrocytes make up 30-50%;
- second (moderate) – 50-70%;
- third (pronounced) – above 70%;
- fourth (sharply expressed) - almost all red cells have a size different from the normal value.
Depending on the increase in the number of certain forms of red blood cells, there are:
- microcytosis - an increase in the number of small cells;
- macrocytosis – increase in the number of macrocytes;
- mixed - an increase in the number of both small and large cells.
Microcytosis is usually observed in the following conditions:
- iron deficiency anemia;
- in case of lead poisoning;
- thalassemia;
- sideroblastic anemia;
- with anemia associated with chronic bleeding;
- for some malignant diseases.
With anisocytosis, red blood cells of both small and large sizes are present in the blood
Macrocytosis may be normal or pathological. In the first case, we are talking about anisocytosis of newborns in the first two weeks of life; by two months the condition is normalized. Pathological macrocytosis is due to the following reasons:
- impaired DNA synthesis, which may be associated with the use of certain medications, myelodysplasia, erythroleukemia, folic acid and cobalamin deficiency.
- pathology of red blood cell membrane lipids in liver diseases, alcoholism, hypothyroidism, after removal of the spleen.
In mixed anisocytosis, both microcytes and macrocytes can predominate. In the first case, as a rule, hypochromic anemia occurs. If macrocytes predominate, then the possibility of B12 deficiency or pernicious anemia cannot be excluded.
Consequences of a low platelet count
The main and most terrible violation of this condition is the possibility of developing massive bleeding even due to a small injury, which is difficult to stop. Such problems are especially dangerous during pregnancy, childbirth and menstruation. Uterine bleeding is very difficult to treat even with a normal platelet level, and if it is reduced, in many cases it can be fatal.
Normal and changes in platelet levels in the blood
In addition, this condition can cause hemorrhage in the brain and in the eyeball and retina. Such disorders can be triggered by even a slight increase in blood and eye pressure.
Attention! The likelihood of such conditions can be reduced by following a correct lifestyle and following recommendations to prevent bleeding due to a low platelet count.
Preventive measures
You can prevent a reduced RDW by following these simple rules:
- The diet should be balanced, which includes plenty of fresh fruits, lean meats and vegetables.
- It is recommended to breathe fresh air as often as possible.
- An active lifestyle will help prevent a decrease in the RDW index.
- It is very important not to skip routine medical examinations, during which most often serious deviations from the norm are detected that do not have external symptoms.
As a result, we learned that the red blood cell distribution index reflects their dimensions relative to each other and makes it possible to learn about their biological value. A decrease in RDW is very rare, but if the erythrocyte distribution index is decreased, this means that various pathologies may be present.
The index is calculated based on the results of a general blood test, but can only be fully valid in conjunction with the MCV indicator, since they are closely interrelated.
Analysis for RDW in MedArt
The medical laboratory is equipped with modern high-precision equipment, high-quality reagents, all necessary consumables and qualified personnel. Our clients can rest assured of the reliability: if all preparation recommendations are followed, the results obtained will be 100% accurate. rdw in the blood test is reduced
Our team performs the work quickly, efficiently and with due understanding. Since there are people who are catastrophically afraid of any medical intervention, including blood sampling, we try to provide all our clients with the most comfortable and calm atmosphere, while performing all hematological studies at the highest level and providing accurate results.
With us, you can take a general blood test in a calm and comfortable environment and get a reliable result in the shortest possible time at an affordable price, without waiting in line for long hours, and then endlessly visiting doctors in an attempt to find out the result. We care about each of our clients and strive to do our work with the highest quality possible.
Preparation for the procedure
Since taking blood for a general analysis does not imply anything unusual, and the study itself is carried out regularly for almost all people, preparation does not require a person to take any special measures, but no one has canceled the standard recommendations before taking tests so that the results are reliable and correctly reflect the clinical picture:
- The RDW test is taken in the morning and on an empty stomach. Dinner in the evening of the previous day before donating blood should be light and at least 8 hours should pass between the last meal and the test, and preferably 12
- It is highly not recommended to drink alcohol 2 days before the test, as it can significantly distort the results
- It is advisable to give up fatty and fried foods, which have a negative effect on the body, 2 days in advance.
- You should not take a blood test after physiological and x-ray procedures
- It is recommended to refrain from smoking one hour before blood collection.
- It is advisable to exclude any physical and emotional stress; before the analysis, a 15-minute break and complete calm are required.
- Particular attention must be paid to the medications you are taking. Almost any medicine can distort the results of a blood test, so before donating blood you need to consult with a specialist: you may have to stop taking the medicine for a while to get an accurate clinical picture, or simply take the drug after the test.
If a repeat blood test is prescribed, it must be taken at the same time (since the composition of the blood may depend on the body’s circadian rhythms) and in the same laboratory. This is due to the fact that units and methods of measurement may vary between laboratories. Only if all recommended measures are followed will the result of the study be correct.
What measures to take?
What to do when the red blood cell distribution index is low?
A highly qualified doctor during a consultation will most likely ask the patient to take the test again, because the RDW indicator is almost never underestimated. Because this suggests that all cells are ideal in their parameters, but this cannot happen in principle. If the indicator is confirmed by repeated analysis, then a full examination of the body’s condition is carried out, paying special attention to oncological examinations.
Smoking is harmful to health
Doctors concluded that smoking provokes an increase in red blood cells. Carbon monoxide, which is contained in tobacco, negatively affects the functioning of hemoglobin. Instead of oxygen, hemoglobin can carry carbon monoxide to cells. In this case, hypoxia occurs and general health deteriorates. Due to the fact that the body is trying to independently cope with the pathological process in the body, a compensatory mechanism is launched, which is aimed at increasing the number of red blood cells and hemoglobin. Nicotine not only disrupts the functioning of the lungs, but also provokes an increase in the width of the distribution of red blood cells by volume.
Possible diseases
Quite often, the level of red blood cells in the blood increases due to the development of serious diseases. In older people, the level of these cells increases if heart or pulmonary failure occurs. Erythrocytosis often develops as a result of impaired water-salt metabolism (dehydration). If the functioning of the kidneys and bone marrow is impaired, the number of blood cells increases. Among the most basic reasons for the increase in the width of the distribution of erythrocytes are:
- water imbalance;
- heart disease;
- tumor neoplasms;
- kidney disease;
- problems in the functioning of the respiratory system;
- massive burn.
Erythrocytosis does not always appear due to the development of the disease. Only a doctor can make a diagnosis based on the patient's test results.