What it is
The thymol test is considered a highly specialized blood test. Its second name is Maclagan's test. With its help, the condition of the liver is assessed, or rather its ability to produce blood plasma protein. In addition, the doctor, based on the sample, evaluates the ratio of protein fractions , which makes it possible to identify some diseases and even predict them before noticeable symptoms appear.
The blood proteins themselves are divided into two general groups, which also have their own subsections:
- globulins;
- albumins.
With the help of the above proteins, the acid-base balance of the blood plasma is regulated, the rate of coagulation is changed, the required volume is maintained, as well as the transport of drug components and other compounds.
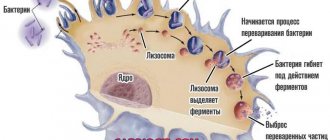
The sample is studied based on the rate of protein sedimentation. For this reason, it is classified as coagulation biochemical studies. A test is carried out by adding a special solution to the resulting serum. As a result, a chemical reaction is observed.
Expert opinion
Kovaleva Elena Anatolyevna
Doctor-Laboratory Assistant. 14 years of experience in clinical diagnostic services.
Ask a question to an expert
If the course is positive, cloudiness of the serum is observed. Depending on the severity of the turbidity of the resulting solution, the result of the sample is determined. It is indicated in Maclagan units, that is, in units of M.
The thymol test is considered an outdated type of test, but is still used in some laboratories. It is prescribed mainly when it is necessary to identify:
- hepatitis type A;
- drug intoxication;
- lupus erythematosus;
- other diseases.
Normal for women
Normal test results depend on the correctness of the tests. This must be done on an empty stomach in the morning, but you are allowed to drink water before the test. When using a study against the background of drug therapy , before the test you should notify the doctor about the use of drugs so that he can make an adjustment for distortion of the results.
In women, the normal thymol test is up to 5 units M. However, with dysproteinemia and taking oral contraceptives, the norm increases. If the indicator is elevated outside of these conditions, then there is a high probability of liver failure. The test itself allows you to identify the stability of proteins, and depending on the indicators, health problems are identified.
An increase in the indicator may not be diagnosed with obstructive jaundice ; only when the disease moves to a more serious stage and with the development of inflammation can a problem be diagnosed.
In addition to jaundice, the absence of a positive result of the thymol test can be observed when the natural ratio of alpha and beta globulins differs, or in the presence of significant amounts of excess or insufficient weight.
It is worth noting that when a person develops hepatitis B, the thymol test does not give a positive result, since its result will vary from 1 to 5 M units , this is not a deviation from normal values.
Indicators of laboratory research norms
What is considered the “norm” for laboratory research?
“The results of the study are outside the normal range,” the doctor tells you, having examined the sheet of analysis results covered with numbers. Are you worried - does that mean you are sick? What might this conclusion, “Beyond Normal” mean? How dangerous is this? These questions can be answered this way: deviation of the test results from the norm means that additional examination is necessary.
The results of the study, like any other medical information, must be analyzed only comprehensively. Consider, for example, one of the most widely used medical indicators: heart rate. You can determine its value right now by counting your pulse on your wrist for a minute. Most people know that a "normal" heart rate is around 70 beats per minute. However, how was it determined that this value was “normal”? To do this, it was necessary to determine the pulse rate of millions of people over many decades.
You may also know that marathon runners and athletes in general often have a much lower heart rate—for them, a “normal” rate is 55 beats per minute. At the same time, when a person climbs the stairs, a pulse rate of even 120 beats per minute will be normal for him. This value exceeds the normal limits for a resting position, but is considered “normal” for a situation of active physical activity.
Therefore, heart rate, like any other medical indicator, should be analyzed in context. Without knowing the relevant context, it is impossible to evaluate the results of any study. To understand what is a normal heart rate for you, your doctor will need to know what is normal for most people your age and your level of physical activity at the time the heart rate is taken (or a few minutes before). When assessing all clinical and laboratory parameters, the results obtained for a given patient are compared with the so-called “reference range” (this is often also called the “norm”, but at present this term is considered insufficiently precise; the reasons for this are discussed on the next page).
What is the definition of the term "reference range"?
For some studies, only two possible results are possible: “yes” or “no”. Is the throat culture result positive for streptococcus? Have antibodies to the virus been detected, indicating infection?
However, there are significantly more studies whose results are determined by the context of the study. Typically, the description of the study results indicates the obtained indicator values and the reference range (or “norm”). For example, a description of the results of a test for thyroid-stimulating hormone (TSH) levels may look like: 2.0 mIU/ml, normal range is 0.4-4.0 mIU/ml. The results of the study indicate that the obtained value is within the reference range.
How was this range determined? The easiest way to imagine it is as the average value of the indicator obtained as a result of examining a large number of healthy people.
The first step in determining a reference range is to identify the group of people for whom this range will be used: for example, healthy women aged 20-30 years. Then, this indicator is determined for a sufficiently large number of people from this group. For the data obtained, the mean and the range of normal values (equal to plus or minus 2 standard deviations from the mean) are calculated.
The term “reference range” seems more appropriate than the term “normal range” because it emphasizes the relative nature of these data and the possibility of their application only to a certain group of people. The use of reference ranges instead of vaguely defined “norms” allows us to describe the conditions for using these comparative indicators more accurately. When assessing the results of a survey of different groups of people, it becomes obvious that “normal” indicator values for one group are not always normal for another. For example, during pregnancy, many biochemical indicators of a woman’s body change, therefore, special reference ranges for the values of these indicators have been defined for pregnant women.
Influence of age and gender
For many indicators, there is no single reference range that can be applied to all people, since the results of the study can be influenced by the age and gender of the subject, as well as a large number of other factors. Alkaline phosphatase is an enzyme found in the cells that make bones, so its concentration in bones increases according to the rate at which new bone cells are formed. In children and adolescents, high levels of alkaline phosphatase are not only normal, but also desirable because the child needs to grow healthy bones. However, the same level in an adult indicates diseases: osteoporosis, metastases of bone tumors (when it begins to grow outside the bones) or others. Therefore, when examining a large number of people in different age groups, different reference ranges were obtained.
During normal aging, hemoglobin levels and hematocrit (a measure of the number of red blood cells) also decrease. In addition, in many studies it is necessary to take into account the gender of the subject:
Creatinine is formed during normal metabolism in the muscles, after which it is released into the blood and removed from the body by the kidneys. Its level is often used to assess the effectiveness of kidney function. Because men have higher muscle mass than women, the reference range for men appears to be higher than for women. The situation is similar with a form of the creatine kinase enzyme called CPK-MB. It is released into the blood when the muscle cells of the heart are damaged, and a high level of CK-MB indicates damage to the heart muscle, so heart attacks (angina) are diagnosed based on the level of this enzyme. Because men have higher muscle mass, their CK levels are also higher. When this study was first introduced, many older women had CPK-MB levels that were significantly lower than the threshold for diagnosing a heart attack, and in this age group of women, the detection rate of heart attacks was underestimated.
Another example: in menstruating women, blood loss may be accompanied by a decrease in hemoglobin and hematocrit levels. Thus, reference ranges for these indicators must be assessed taking into account both the age and gender of the subject.
Other factors influencing research results
Typically, laboratories, along with the test results, also report the reference range of results for a given subject, taking into account his age and gender. After this, the doctor will need to evaluate the results obtained in accordance with the individual data about the patient, including the medications and herbal preparations he receives. In addition, many other factors may affect the results of the study: coffee consumption, smoking, alcohol or vitamin C intake; diet (vegetarian or meat); stress or anxiety; pregnancy. Some results may even be affected by the position of the subject’s body at the time of the study, as well as the presence of physical activity before the test. For example, standing up from a lying position may increase albumin and calcium levels in the blood.
A number of rarely taken into account factors can also influence the results of the study, for example, the profession of the subject, altitude above sea level, distance from the ocean. In addition, the results of some studies can be affected by physical activity (in particular, during exercise, the levels of creatine phosphokinase - CPK, aspartic aminotransferase - AST, lactate dehydrogenase - LDH increase). In addition, during prolonged intense physical activity (for example, marathon runners and weightlifters), levels of testosterone, luteinizing hormone (LH), and platelets may increase.
All these examples show that for the correct assessment of the results of laboratory (as well as outpatient - carried out at home) tests, it is important to obtain blood and urine samples under standardized conditions. In preparation for the study, the subject is required to follow the doctor’s instructions, for example, to come to donate blood for the study in the morning and on an empty stomach. Compliance with these instructions will allow the analysis to be carried out as close as possible to the general requirements, and thereby bring the study results as close as possible to the reference ones for this group of patients.
When “norms” are not considered
In some studies, for example, when determining cholesterol levels, in the vast majority of cases, instead of determining reference ranges, it is enough to only assess whether the result exceeds a certain threshold value, the so-called “red flag”. Scientific research shows that when cholesterol levels rise to 200 milligrams per deciliter, the risk of heart damage increases enough to require treatment; in this case, the relationship between the research results and the ranges of statistically “normal” values no longer plays a role.
In addition, reference ranges are not considered in a number of other situations. For example, determination of the blood level of a particular drug in an unconscious patient is carried out to assess the intended effect of that drug, and not the relationship of the concentration to the reference range.
In addition, a medical assessment is required when there is a marked change in indicators of medical significance, even if they do not fall outside the reference range.
How are study results outside the reference range assessed?
According to probability statistics, every twentieth (or 1 in 20, or 5%) study result may fall outside the true reference range; therefore, the result of an individual study cannot be considered statistically significant. Typically, study results are only slightly outside the reference range. However, it should be remembered that in a healthy person, if the same study is repeated 20 times, with a high probability one of the results of this study will be outside the reference range, despite the fact that the subject does not have any health problems.
Of course, sometimes results outside the reference range indicate disease. The first thing your doctor should do to check this is repeat the test. It is possible that the test result outside the reference range was due to one of the reasons mentioned above, or the rules for processing the test sample were violated (the blood sample was not frozen, or the serum was not separated from the red blood cells, or the sample was kept warm).
Typically, laboratories present test results based on the age and gender of the person being examined, and the doctor, when assessing them, also takes into account other factors, in particular, the diet and level of physical activity of the person being examined, as well as the drug therapy he is receiving. If any factors may affect the test results, be sure to tell your doctor about them.
Why is this document not providing specific reference ranges?
Although we discuss issues related to reference ranges in some detail, these ranges themselves are almost not given in our document. There are several reasons for this:
International standards are accepted only for a very small number of indicators (for example, for cholesterol, glucose, prostate-specific antigen levels). For these few indicators, significant efforts have been made to standardize all laboratory methods and forms of reporting their results. We mention the adopted target levels for these indicators. These thresholds should be distinguished from reference ranges because they serve as “red flags” for medical decision making rather than being statistically “normal” ranges. For most other studies, each laboratory conducting a given study determines reference ranges independently. Different laboratories use different types of equipment and use different research methods. This means that laboratories have to establish their own reference ranges, and indicate, along with the obtained test result, also the reference range for it. Thus, the physician and patient should use the reference range specified by the laboratory conducting the study, and not any theoretically calculated or reference range values derived from the literature.
Different laboratories report the results of many studies in different units, national or international. In the USA, laboratories often use “conventional units”, and in Europe, as in other parts of the world, they use international ones, described in the SI system (“systeme internationale,” or SI). For example, for iron content the reference range may be in conventional units 400-1600 µg/l (micrograms per liter), while in the SI system it is equal to 7.16-28.6 µmol/l (micromoles per liter). If your laboratory uses units other than those used in this document to determine reference ranges, using them together may cause significant confusion and misjudgment. If you have any doubts, we advise you to consult a doctor.
We are trying to provide you with information, but not a substitute for consulting a doctor. We hope that you can better understand what laboratory tests are, but we cannot predict all the factors that may affect the results of the tests you perform, so in the absence of additional data we do not undertake to evaluate their results.
If you require further clarification regarding test results, consult your doctor.
Common Misconceptions
There are two common misconceptions regarding research results and reference ranges:
Opinion: “Deviation of test results from the norm means the presence of a disease.”
Truth: If test results fall outside the reference range, it does not always mean the presence of a disease - it is only a sign for the doctor that additional examination is necessary. Sometimes deviations in test results from the norm occur in completely healthy people - but it is better to leave the right to decide on this to the doctor.
It is possible that the test result will be among the 5% of normal results that are outside the statistically determined reference range. In addition, it should be remembered that the results of the test can be influenced by a large number of factors that do not indicate the presence of the disease: for example, high blood glucose levels may not be due to diabetes, but to a high sugar diet. Lipid (fat) levels may be high if the person being examined has eaten shortly before receiving blood for testing. Liver enzyme levels may rise temporarily after drinking alcohol, and these increases do not necessarily indicate cirrhosis. New drugs are constantly appearing on the market, and laboratories do not always have time to check whether taking these drugs affects the results of studies. It is not uncommon for many of these medications to interfere with the results of some studies without the change being medically significant. Most likely, if deviations from the reference range are detected, the doctor will decide to repeat the study. Sometimes altered results, especially those near the edge of the reference range, normalize on their own. In addition, the doctor will try to find an explanation for the identified changes in results; perhaps it would be one of the explanations given above. The key question will be: how far does the result deviate from the reference range?
If the results of the examination reveal the disease, the doctor will be able to clarify its severity. However, very rarely is one study sufficient to answer these questions.
Opinion: “If the test results are normal, there are no diseases.”
Truth: Of course, it is nice to get such results, but they do not guarantee that everything is in order. The results of studies in healthy and sick people often overlap, so when analyzing the results there is always a small chance of missing an existing disease. Just as some healthy people have laboratory results outside the reference range, some sick people have laboratory results within this range. If you are trying to maintain a healthy lifestyle, these results show that you are on the right track. However, if your behavior is associated with risk factors, such as drug and alcohol abuse, dietary errors, these results will only be good for a while and should not be expected to last long. Good research results are not an indulgence in a bad lifestyle.
If abnormalities in laboratory parameters were previously detected in you, the appearance of normal test results certainly indicates a favorable change in the course of the disease. However, in many cases, the doctor still decides to repeat the studies after a few months to ensure that the favorable changes are maintained and to prove the presence of a corresponding trend.
| Name | Units | Reference values |
| Immunological studies | ||
| Thyroid group | ||
| TSH | µIU/ml | 0.4 - 4.0 Pregnant women 0.2-3.5 |
| T 3 general | nmol/l | 1,3-2,7 |
| T 3 free | pmol/l | 2,3-6,3 |
| T 4 general | nmol/l | 54-156 Pregnant.Itr 100-209 Pregnant II, IIItr 117-236 |
| T 4 free | pmol/l | 10.3-24.5 Pregnant.Itr 10.3-24.5 Pregnant.II,IIItr 8.2-24.7 |
| Thyroglobulin | ng/ml | <56 |
| Thyroxine binding globulin | nmol/l | 259-575,5 |
| A/T to thyroglobulin | IU/ml | |
| A/T to thyroid peroxidase | IU/ml | <35 |
| A/t to the TSH receptor | Chalk | 1.8 - 2.0 borderline >2.0 positive |
| Reproductive group | ||
| FSH | mIU/ml | Follicular phase - 2.8-11.3 Mid-cycle - 5.8 - 21 Luteal phase - 1.2 - 9.0 Oral contraceptives - 0-4.9 Postmenopause -21.7-153 + replacement. therapy - 9.7-111.0 Men 0.7-11.1 |
| LH | mIU/ml | Follicular phase-1.1-11.6 Mid-cycle-17-77 Luteal phase-0-14.7 Oral contraceptives-0-8 Postmenopause-11.3-40 Men -0.8 -7.6 |
| Prolactin | mIU/l | Women: 40.3 - 530 Follicular phase -98-784 Mid-cycle - 134 - 975 Luteal phase - 104 - 848 Pregnancy Itr.68-912 Pregnancy IItr.276-3519 Pregnancy IIItr.276-6742 Men - 53 - 360 |
| Testosterone | nmol/l | Men: 20-49 years old 8.5-55.5; > 50 years old - 6.3-26.8; Women:0-2.8; Oral contraceptives-1.9-2.5 Ber-st Itr.1-8; IItr.1-6.9; IIItr.1-6.6; Postmenopause-0-2.6 |
| Free testosterone | pg/ml | Men: M=16 (5.5-42) Women: M=1.3 (0-4.1) |
| Estradiol | pmol/l | Foliculin phase 0-587 Mid-cycle 124-1468 Luteal phase 101-905 Postmenopause Men: 0-206 |
| Progesterone | nmol/l | Follicular phase-0-3.6 Mid-cycle-1.52-5.46 Luteal phase-3.02-66.8 Oral contraceptives-1.08 -3.0 Pregnancy Itr.29.6-105.6 Pregnancy IItr.93.8-159 Pregnancy IIItr.264.6-508.8 Postmenopause 0-3.18 Men 0-2.4 |
| SHBG | nmol/l | Men: 13-71 Women: 18-114 |
| Adrenal hormones | ||
| DHEA | µmol/l | Women: 0.9 - 11.7 Pregnancy Itr.3.1-12.5 Pregnancy IItr.1.7-7 Pregnancy IIItr.0.86-3.6 Men: 2.2 - 15.2 |
| 17 OH-progesterone | ng/ml | Children 1-12 years old 0.07-1.2 Men 0.5-2.4 Women: Fol. phase 0.2-1.2; Lute. phase 1.0-3.1; Menopause 0.2-1.3; Ber-st I tr. 1.3-3.0; II tr. 2.0-5.0; III tr. 5.0-8.3 |
| Cortisol | nmol/l | Before noon 138 - 690, Afternoon - 0.5 morning values |
| Nephrins in daily urine | mcg/day | MetanephrineNormethanferine |
| Nephrins in blood plasma | pg/ml | Normetanephrine Metanephrine <90 |
| Catecholamines (adrenaline, norepinephrine, dopamine) blood/urine | In the blood: adrenaline - up to 100 pg/ml norepinephrine - up to 600 pg/ml dopamine - up to 100 pg/ml In the urine: adrenaline - up to 20 mcg/day norepinephrine - up to 90 mcg/day dopamine - up to 600 mcg/day | |
| Pituitary hormones | ||
| ACTH (blood sampling only directly in the laboratory) | pg/ml | 0 — 46 |
| GH (growth hormone) | ng/ml | 0,06 — 5,0 |
| Diagnosis of anemia | ||
| Vitamin B12 | pg/ml | Norm 180 - 900 Borderline. values 130 - 180 Insufficiency 0 - 130 |
| Folic acid | ng/ml | 3-17 |
| Erythropoietin | mIU/ml | 2,6-34 |
| Ferritin | ng/ml | husband: 20-350 wife: 10-150 pregnancy: 1 tr - 60-90 2 tr - 25-70 3 tr - 10-15 |
| Diabetology | ||
| C-peptide | ng/ml | 0,9-4,0 |
| Immunoreactive insulin | µIU/ml | 4,3-15,3 |
| Microalbumin in daily urine | mg/day | 0-25 |
| Markers of osteoporosis | ||
| Osteocalcin | ng/ml | 3,1-13,7 |
| Deoxypyridinoline (urine!) | nM/mMcrea tinine | Men 2.3 - 5.4 Women 3.0 - 7.4 |
| Markers of autoimmune pathology | ||
| Antibodies to phospholipids IgG/IgM - screening | IU/ml | |
| Total antibodies to cardiolipin | IU/ml | |
| Complex of autoantibodies to phospholipids (IgG/IgM to b2-glycoprotein, cardiolipin, phosphatidylserine, phosphatidylinositol, phosphatidylic acid) with conclusion | U/ml | <=10 |
| Antibodies to sperm | IU/ml | 0-60 |
| Ovarian antibodies | mIU/ml | 0-10 |
| Tumor markers | ||
| PSA | ng/ml | Normal 0-4 Borderline values 4-10 Pathological values >10 |
| PSA free | ng/ml | 20l.-40l.: 0-0.33 40l.-50l.: 0.04-0.39 50l.-60l.: 0.058-0.49 60l.-70l.: 0.084-0.87 |
| CA 125 | IU/ml | Normal 0-30 Borderline values 30-40 Pathological values >40 |
| REA | ng/ml | Normal 0-5 Borderline values 5 -8 Pathological values >8 |
| SA-15-3 | IU/ml | 9,2-38 |
| SA-19-9 | IU/ml | Normal 0-30 Borderline values 30-40 Pathological values >40 |
| hCG | mIU/ml | MenNon-pregnant women |
| AFP | IU/ml | up to 15 |
| Other analytes | ||
| Parathyroid hormone | pmol/l | 1 year-17 years: 1.26-10.0 18 years-22 years: 1.3-7.6 23 years-70 years: 1.0-7.9 71 years-94 years: 0.5-12 .0 |
| Insulin-like growth factor I | ng/ml | Adults 55-358 |
| Estramet (estradiol metabolites) | Cr/ng/mg | 16aONE1: 9.9-15.2 postmenopause: without HT - 3.9 with HT - 12.3 2ONE1: 13.1-23.7 postmenopause: without HT - 5.5 with HT - 38.2 Total metabolites: foul . phase - 6.1-79.5 ovulation - 8.1-166.0 lute. phase - 4.9-82.6 Ratio (2ONE1/16aONE1): 1.45-1.67 postmenopause: without HT - 1.53 with HT - 2.77 The result is issued with the conclusion of a laboratory doctor |
| Homocysteine | µmol/l | 5-12 |
| Calcitonin | pmol/l | Men 0 - 5.33 Women 0 - 3.36 |
| Troponin I | ng/ml | 0 — 1,0 |
| Sexual infections - ELISA | ||
| Chlamydia trachomatis IgA/IgG | c.u. | 0.9-1.1 USD — doubtful 1.1-5.0 c.u. — 1/10 5.1-7.5 c.u. — 1/20 >7.5 c.u. — 1/40 |
| Trichomonas IgG/IgA | cu | 0.9-1.1 USD — doubtful 1.1-3.0 c.u. — 1/5 3.1- 5.0 c.u. — 1/10 5.1 — 7.0 c.u. — 1/20 7.1 — 9.0 c.u. 1/40 >9.1 – 1/80 |
| Mycoplasma hominis IgG | c.u. | 0.9-1.1 USD — doubtful 1.1-2.0 c.u. — 1/10 2.1-3.0 c.u. — 1/20 3.1-5.0 c.u. — 1/40 5.1-8.0 c.u. — 1/80 >8.1 c.u. — 1/160 |
| Mycoplasma hominis IgA | c.u. | >1.1 USD — 0.9-1.1 c.u. identified - doubtful |
| Ureaplasma urealiticum IgG/IgA | c.u. | 0.9-1.1 USD — doubtful 1.1-1.5 c.u. — 1/10 1.6 — 2.0 c.u. — 1/20 2.1 — 3.0 c.u. 1/40 3.1 - 4.0 c.u. - 1/80 >4.0 c.u. — 1/160 |
| Candida albicans IgG | c.u. | 0.9-1.1 USD — doubtful 1.1-2.0 c.u. — 1/200 2.1-5.0 c.u. — 1/400 5.1-8.0 c.u. — 1/800 8.1 — 11.0 c.u. 1/1600 |
| Gastrointestinal infections - ELISA | ||
| H.Pilory IgG titer (USA) | IU/ml | <1 |
| Opisthorchiasis (antibodies) | c.u. | >1.1 USD — 0.9-1.1 c.u. identified - doubtful |
| Giardiasis (antibodies) | c.u. | >1.1 USD — 0.9-1.1 c.u. identified - doubtful |
| TORCH infections - ELISA | ||
| Toxoplasmosis IgG | IU/ml | <8 |
| Toxoplasmosis IgM | c.u. | >1.1 USD — 0.9-1.1 c.u. identified - doubtful |
| Avidity Toxoplasmosis IgG | % | 41-59% - transitional >60% highly avid |
| Rubella IgG | IU/ml | up to 5 - not detected up to 15 - low level up to 40 protective level >40 - high level |
| Rubella IgM | c.u. | >1.1 USD — 0.9-1.1 c.u. identified - doubtful |
| Avidity Rubella IgG | % | 51-69%-transitional >70%-high-avidity |
| CMV IgG | c.u. | 0.9-1.1 USD — doubtful 1.1-15.0 USD — 1/100 15.1-25.0 c.u. — 1/200 25.1-35 USD — 1/400 35.1-45 c.u. 1/800 >45.0 c.u. — 1/1600 |
| CMV IgM | c.u. | >1.1 USD — 0.9-1.1 c.u. identified - doubtful |
| CMV IgG avidity | % | >41% high avidity |
| HSV IgG | c.u. | 0.9-1.1 USD — doubtful 1.1-5.0 c.u. — 1/100 5.1-10 c.u. — 1/200 11-20 USD — 1/400 21-70 USD 1/800 >70 – 1/1600 |
| HSV IgM | c.u. | >1.1 USD — 0.9-1.1 c.u. identified - doubtful |
| HSV IgG avidity | % | >50% high avidity |
| Other infections - ELISA | ||
| Chlamydia pneum/psitaci IgG | c.u. | 0.9-1.1 USD — doubtful 1.1-2.0 c.u. — 1/10 2.1-5.0 c.u. — 1/20 5.1-8.0 c.u. 1/40 8.1 – 11.0 – 1/80 |
| Chlamydia pneum/psitaci IgM | c.u. | >1.1 USD — 0.9-1.1 c.u. identified - doubtful |
| Mononucleosis early IgG | c.u. | >1.1 USD — 0.9-1.1 c.u. identified - doubtful |
| Mononucleosis late IgG | c.u. | 3.5 - 5 - doubtful >5 positive |
| Borreliosis IgG | c.u. | >1.2 c.u. - identified 0.8-1.2 c.u. - doubtful |
| Toxocariasis IgG | c.u. | 0-0.9 - not identified 0.9-1.1 - doubtful 1.1-1.73 - 1/2 1.74-2.8 - 1/4 2.81-3.9 - 1/8 3.91-6.7 - 1/16 6.71-8.88 - 1/32 8.89-11.6 - 1/64 11.6-13.4 - 1/128 13.41-15, 2 - 1/256 15.21-17.1 - 1/512 17.11-19.0 - 1/1024 18.9-20.8 - 1/2048 |
| Biochemical research | ||
| ALT | U/l | adults up to 45 newborns and children up to 45 |
| AST | U/l | adults up to 35 newborns up to 75 children up to 60 |
| Total bilirubin | µmol/l | adults 1.7-21 newborns: 1 day - up to 85.5 2 day - up to 154 3-5 days - up to 205 children - up to 25.7 |
| Direct bilirubin | µmol/l | adults up to 4.6 |
| Bilirubin indirect | µmol/l | 1,7-16,4 |
| Thymol test | c.u. | 0-4 |
| GGT | U/l | men up to 55 women up to 40 |
| Alkaline phosphatase | U/l | adults 20-120 newborns 48-406 children up to 1 year 80-380 children 40-400 |
| Alpha amylase | U/l | adults 28-100 |
| LDH | U/l | up to 248 |
| Creatine kinase | U/l | men up to 195 women up to 170 newborns: 1 day up to 712 2-5 days up to 652 children: up to 3 years up to 258 4-6 years up to 149 |
| Glucose | mmol/l | adults 3.5-5.9 newborns: 1 day 0.33-3.3 5 day 0.72-4.2 children: 1-2 years 1.8-6.2 3-4 years 2.9-5 .4 5-6 years 3.8-5.5 |
| Fructosamine | µmol/l | up to 285 |
| Glycosylated hemoglobin | % | adults 3.8-6.2 |
| Triglycerides | mmol/l | men 0.68-1.9 women 0.45-1.6 |
| Beta cholesterol | mmol/l | up to 3.3 |
| Cholesterol | mmol/l | adults 3-5.2 newborns 1.3-4.4 children up to one year 1.6-4.9 children 2.8-6 |
| Alpha cholesterol | mmol/l | 1,03-1,86 |
| Atherogenic index | c.u. | up to 4 |
| Total protein | g/l | adults 67-87 newborns 46-68 children under 1 year 60-80 |
| Albumen | g/l | adults 35-52 newborns 38-42 |
| Total calcium | µmol/l | adults 2.15 - 2.65 newborns 2 - 3.25 children 2.5 - 3 |
| Potassium | µmol/l | adults 3.4-5.1 |
| Sodium | µmol/l | adults 136-146 |
| Chlorine | µmol/l | adults 96 – 106 |
| Phosphorus | mmol/l | adults 0.87 - 1.45 newborns - 1.78 children under one year old 1.29 - 2.26 children 6.4 - 16 |
| Magnesium | mmol/l | 0,65 — 1,05 |
| Iron | µmol/l | men 12.5-32.2 women 10.7-32.2 newborns 17.9-45 children under one year old 7.2-17 children 9-21.5 |
| OZHSS (only when prescribing iron) | µmol/l | 45,3 — 77,1 |
| Transferrin | g/l | men 2.2-3.65 women 2.5-3.8 children: 0-4 days 1.3-2.75 3 months-10 years 2.03-3.6 |
| SRB | mg/l | 0-5 |
| Rheumatoid factor | Chalk | 0-14 |
| ASLO | IU/ml | adults 0-200 children 0-150 |
| Uric acid | µmol/l | men 200-430 women 140-350 newborns - up to 311 children under one year - up to 372 children - up to 362 |
| Blood urea | µmol/l | adults 2.8 - 7.5 children 1 - 6 months - up to 7.0 children - up to 8.0 |
| Creatinine | µmol/l | men 70-120 women 60-100 newborns 27-88 children under one year old 18-35 children 27-62 teenagers 44-88 |
| Glomerular filtration rate | ml/min | from 70 to 150 |
| Reabsorption | % | 97-99% |
| Ceruloplasmin | g/l | 0,2-0,5 |
| Alpha1-antitrypsin | g/l | 0,9-2,0 |
| Studies of the hemostasis system | ||
| APTV | sec | 28,6-33,6 |
| Prothrombin time | sec | 9,2-12,2 |
| PTI | % | 80-105 |
| INR | c.u. | 0,9 — 1,5 |
| Thrombin time | sec | 18-24 |
| Fibrinogen | g/l | 2-4 |
| RFMK | mg/100 ml | up to 4 |
| XIIa dependent fibrinolysis | min | 4-10 |
| Antithrombin III | % | 86-116% |
| Plasminogen | % | 71-101% |
| Lupus anticoagulant (screening) | c.u. | 0,7-1,19 |
| Induced platelet aggregation with a universal inducer | sec | 8-12 s |
| D-dimer | ng/ml | 33,5-727,5 |
| Lupus anticoagulant (confirmatory test) | c.u. | <1.2 - normal 1.2-1.5 - slightly present 1.5-2.0 - moderately present >2.0 - strictly present |
| Protein C | % | 94-124% |
| General clinical studies | ||
| General blood analysis | ||
| Absolute leukocyte count | PC | 4.0 - 10.0 x 10*9/L |
| Absolute lymphocyte count | PC | 0.8 – 4.0 x 10*9/L |
| Absolute number of medium-sized cells (eosinophils, basophils, atypical lymphocytes) | PC | 0.1 – 0.9 x 10*9/L |
| Absolute value of granulocytes | PC | 2.0 - 7.0 x 10*9/L |
| Lymphocyte percentage | % | 20.0 — 40.0 |
| Percentage of medium-sized cells (eosinophils, basophils, atypical lymphocytes) | % | 3.0 — 9.0 |
| Granulocyte percentage | % | 50.0 — 70.0 |
| Myelocytes | % | 0 |
| Monocytes | % | 3-9 |
| Plasma cells | % | 0-1 |
| Band neutrophils | % | 20-40 |
| Segmented neutrophils | % | 50-70 |
| Eosinophils | % | 0-5 |
| Red blood cell count | PC | 3.5 – 5.5 x 10*12/L |
| Hemoglobin concentration | g/l | 110 — 160 |
| Average red blood cell volume | fl | 82.0 — 95.0 |
| Average hemoglobin content in an erythrocyte | pg | 27.0 — 31.0 |
| Average hemoglobin concentration in erythrocyte | g/l | 320 — 360 |
| Width of distribution of erythrocytes by volume % | % | 11.5 — 14.5 |
| Width of distribution of red blood cells by volume FL | fl | 35.0 — 56.0 |
| Hematocrit | % | 37.0 — 50.0 |
| Platelet count | PC | 100 – 300 x 10*9/L |
| Average platelet volume | fl | 7.0 — 11.0 |
| Distribution width of platelets by volume | 15.0 — 17.0 | |
| Thrombocrit | % | 0.108 — 0.282 |
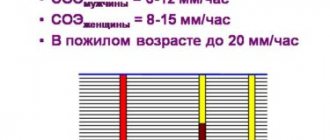
| Erythrocyte sedimentation rate (ESR) | mm/hour | Children 2-10 Adults m: 2-15 f: 2-20 >50 years old: m: 2-20 f: 2-30 |
| Urinalysis according to Nechiporenko | PC | Red blood cells: up to 1000 * 10 * 6/l Leukocytes: up to 4000 * 10 * 6/l |
| Rhinocytogram (imprint smear from the pharynx for eosinophilia and flora) | % | 0-5% eosinophils |
| Allergy research | ||
| Total IgE | IU/ml | Adults, children 0-1 years old, children 1-2 years old, children 2-3 years old, children 3-9 years old. |
| Specific IgE antibodies | IU/ml | Class O - Class I - 0.35-0.7 Class II - 0.7-3.5 Class III - 3.5-17.5 Class IV - 17.5-52.5 Class V - 52.5- 100 Class VI - >100 |
| Specific IgG antibodies | mg/l | 50-100 - low amount 100-200 - moderate amount >200 - high amount |
Promoted
If the test result is positive, liver damage is diagnosed. Today, a positive test result is also observed in diseases of the kidneys, digestive system, and the appearance of malignant neoplasms. Due to the inaccuracy of diagnosing the disease, it is necessary to carry out additional research to identify the exact reason for the deviation of the thymol test from the norm.
Expert opinion
Kovaleva Elena Anatolyevna
Doctor-Laboratory Assistant. 14 years of experience in clinical diagnostic services.
Ask a question to an expert
Increased test results can be observed without pathologies. Most often, increased results appear in people who often eat fatty foods. There is an increase in cholesterol in their blood.
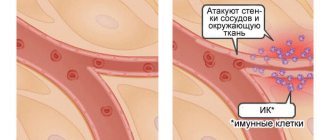
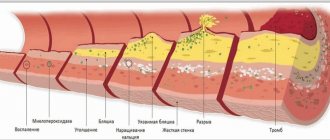
The gradual accumulation of lipoproteins will contribute to their deposition in blood vessels and the formation of atherosclerotic plaques.
Their formation contributes to the development of atherosclerosis. Thus, if the result of the thymol test is elevated, but there are no clinical manifestations of the disease, then it is necessary to urgently change the diet .
Advantages of thymol test
Typically, a thymol test is used in addition to bilirubin and enzymes (transaminases - AlT, AST, alkaline phosphatase) if damage to an organ is suspected, characterized by the variety of biochemical reactions occurring in it. Of course, we are talking about the liver, on the normal functioning of which the implementation of basic life processes in all cells of a living organism largely depends. And what’s interesting is that these indicators may not yet particularly respond to pathological changes and therefore may not exceed or slightly exceed the levels of normal values, and the thymol test will already clearly “creep” upward.
In addition to identifying liver abnormalities, the thymol test, the norm of which is from 0 to 4 SH units, in other cases helps in diagnosing pathological conditions of the heart, gastrointestinal tract, kidneys and other organs.
The main advantages of the thymol test are that it:
- Does not require special time and material costs, or the use of complex equipment (reagents are prepared on a magnetic stirrer in a fume hood);
- It is easy to perform (the result is read using an electrospectrophotometer, which is available in any laboratory);
- Makes it possible to start treatment in the early stages of the disease and thus helps to avoid unwanted complications caused by a prolonged inflammatory process;
- Can be used as a good indicator of the effectiveness of therapeutic measures aimed at restoring the functional abilities of the liver tissue.
That is why, despite the wide variety of new laboratory tests, in some cases the thymol turbidity test remains among the main tests that identify pathological conditions of the liver.
Causes
An increase in sample values may be caused by the following reasons:
- kidney diseases;
- large area burns;
- strict diets;
- genetics;
- frequent consumption of fatty foods;
- systemic diseases;
- endocarditis;
- diseases of the gastrointestinal tract;
- rheumatoid diseases;
- myeloma;
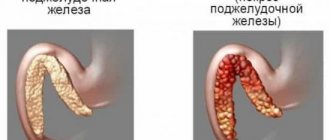
- pancreatitis;
- energite;
- hepatitis;
- various types of neoplasms in liver tissue;
- damage to the liver parenchyma by alcohol substitutes or alcohol;
- poisoning by poisons, metals, drugs;
- cirrhosis;
- fatty damage to liver tissue;
- long-term use of hormonal drugs;
- liver diseases of various etymologies.
It is the last point that most often leads to an increase in sample rates. However, to calculate an accurate diagnosis, it is recommended to visit a doctor and get prescriptions for treatment.
Expert opinion
Kovaleva Elena Anatolyevna
Doctor-Laboratory Assistant. 14 years of experience in clinical diagnostic services.
Ask a question to an expert
A special feature of the thymol test is its ability to detect type A hepatitis in the early stages, however, the test is not informative if a person has already had hepatitis before and was successfully cured. Therefore, to clarify the diagnosis, it is recommended to undergo additional tests.
In order for the results of the study to be as reliable as possible, it is necessary
to prepare in advance for the test .
A week before the test, it is recommended to follow a diet with limited fat and sugar intake. The day before the study, you must give up coffee, tea, and alcohol. The sample itself is taken in the morning on an empty stomach; for this reason, eating is not recommended 12 hours before the test. In the morning you can only drink water in limited quantities, and you cannot eat anything.